To display a record of information in a graphical interface, pie charts, bar diagrams, and other such chart diagrams are the best ways to present or communicate information visually. If you don’t have Microsoft Office installed, then free online tools are very useful for creating chart diagrams. You don’t have to download or install anything on your computer.
Pie Chart Maker & Bar Graph Maker online tools
Today we will see some of the best online tools for creating different kinds of chart diagrams such as Bar diagrams, Pie charts, line charts, bubble charts, and radar plots.
1] Chart Tool
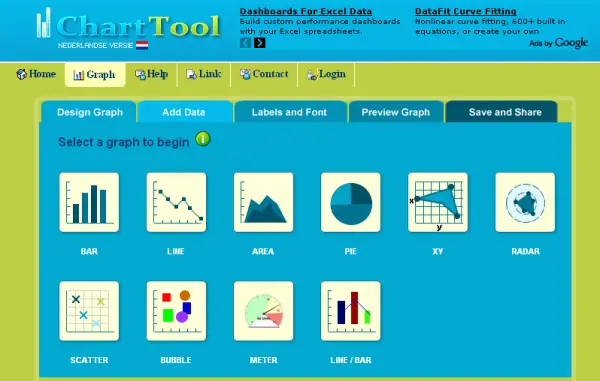
Chart Tool is a simple web tool that lets you create different chart diagrams in five easy steps. All you need to do is, just choose the chart type, add data of your graph, and determine the settings for the data labels, fonts, colors, etc.
Once everything is done, preview the graph, save it as an image or email and share it with your friends.
2] ChartGo
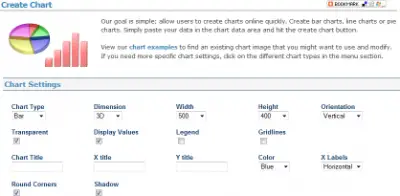
ChartGo is the simplest tool that allows users to create charts online quickly. You can create bar charts, line charts or pie charts. Simply paste your data in the chart data area and hit the create chart button.
It provides all the text fields for entering the data, so just simply enter the data and get your charts ready!

3] Chartle
Chartle lets you create interactive charts online. It removes the complexity of online visualizations and provides us the simplest way to create charts online.
4] Canva Pie Chart Maker

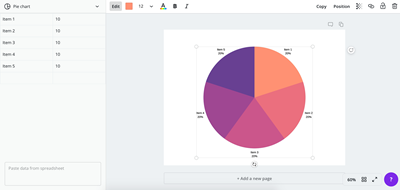
Using Canva Pie Chart Maker, you can create beautiful, customized graphs and charts in minutes, online graphs and charts maker. It is a free tool, and you can download the chart after you have finished your graph.
Know of any more? Please do share!


thankyou for this usefull post
That’s really an interesting topic, hope the WinForms UI pie chart I am planning to use can rival the effect in this article.