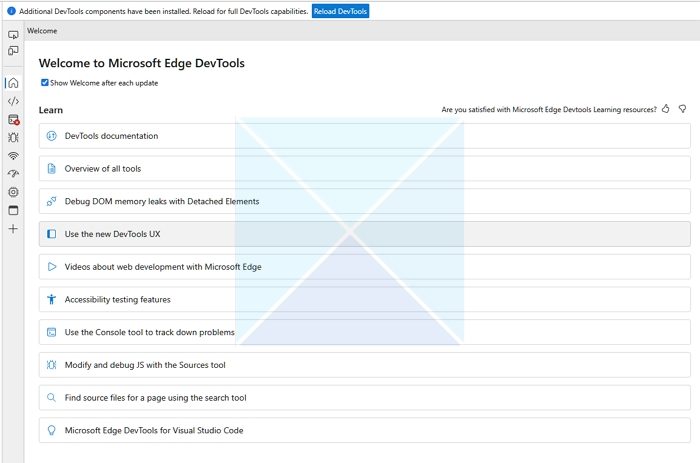
The Developer Tools in the new default browser of Windows 10 – Microsoft Edge, have been equipped with the necessary tools to help web developers test their websites in Microsoft Edge. However, failures can occur. So, to prevent such occasional failures and ensure all things work as expected, Edge has a dedicated section for error messages alongside their solutions. For instance, when you see an error message ‘An error occurred while starting the profiling session’ in the DevTools Memory Panel, here’s what you can do to fix it quickly.

An error occurred while starting the profiling session in Edge DevTools
To fix this error associated with the Memory Panel of Edge (Chromium) DevTools, we’ll need to take two steps:
- Access Microsoft (R) Diagnostics Hub Standard Collector Service.
- Restart the Microsoft (R) Diagnostics Hub Standard Collector Service.
A Memory panel primarily measures your use of memory resources and compare heap snapshots at different states of code execution. The Memory panel provides profiling of three different types:
The Memory panel provides profiling of three different types:
- Heap Snapshot
- Record Allocation Timeline
- Record Allocation Profiles
Using this panel, we can find issues affecting page performance in most common scenarios, including memory leaks and bloats.
1] Access Microsoft (R) Diagnostics Hub Standard Collector Service
To access Microsoft (R) Diagnostics Hub Standard Collector Service, open the ‘Run’ dialog box, type ‘services.msc’ in it, and press Enter.
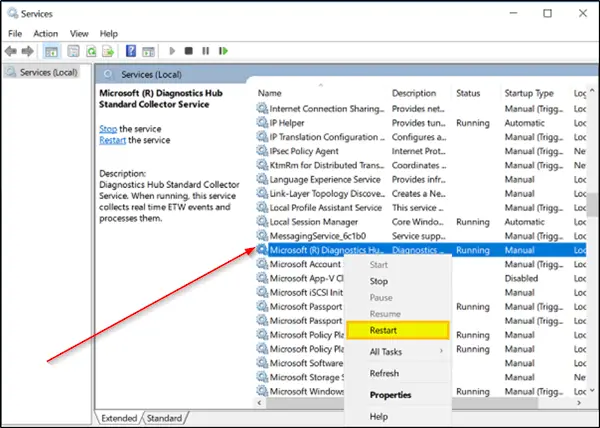
Then, from the Services (local) panel that opens on the right-hand side, locate Microsoft (R) Diagnostics Hub Standard Collector Service.

2] Restart the Microsoft (R) Diagnostics Hub Standard Collector Service
Now, after getting to Microsoft (R) Diagnostics Hub Standard Collector Service, right-click it and choose the ‘Restart’ option.

When done, close the Microsoft Edge Developer Tools tab. Open a new tab, navigate to your page, and press F12.

You should now be able to begin profiling, as seen in the screenshot above.
That’s it!
Where is the profile in Microsoft Edge?
Like any browser, Microsoft Edge offers users to create multiple profiles in the browser. They are helpful if you want to separate user activities from each other. To access the profile in Microsoft Edge, click on the three dots at the top right corner of the browser window. Then, click on “Settings” from the dropdown menu. In the left-hand menu, select “Profiles.” The profile includes a picture, name, email, and so on. You can add or remove profiles and manage profile settings from this menu.
How do I delete my Edge profile?
First, you must create a new profile by visiting Settings > Profiles. Once you have created it, switch to it, and then go to the profile settings again. Here you can now choose to delete the older profile. When you delete a profile in the browser, everything is deleted, including passwords, bookmarks, history, and more.