Google Chrome is one of the popular web browsers for web development due to its advanced features. Chrome Developer Tools can be very useful while debugging. Most of us already know that we can edit the live CSS using Chrome Dev Tools, but there are more tips that we will share with you today.

Chrome Development Tools tips
There are many unknown and hidden tricks of Chrome Dev Tools and we will be looking into the most useful ones. To open the developer tools in Chrome, press F12 on your keyboard and try the following tricks.
1. Find and Open any file
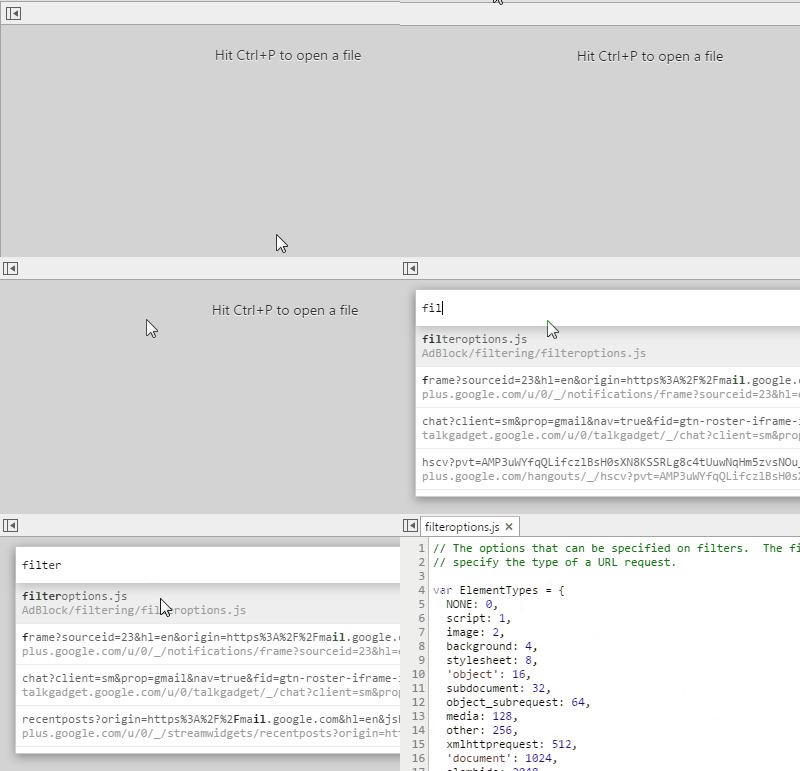
When doing web development, we deal with many HTML, CSS, JS, and other files. When we want to debug anything, we open Chrome Dev tools. You can quickly search and find the particular file to make your job easier. Just press Ctrl + P and start typing the file name. This helps you to find the particular file from the list of files.
2. Search within the source file
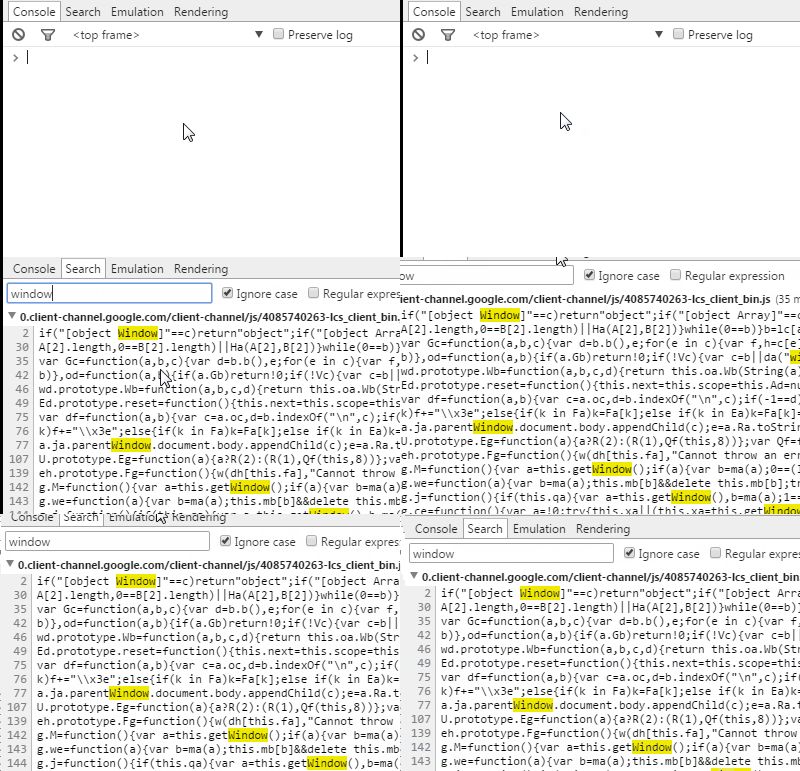
We learned how to search for a particular file in the previous trick. You can even search for a particular string in all the loaded files. Press Ctrl + Shift + F to search for a string in files. It also supports regular expressions.
3. Go to a particular line
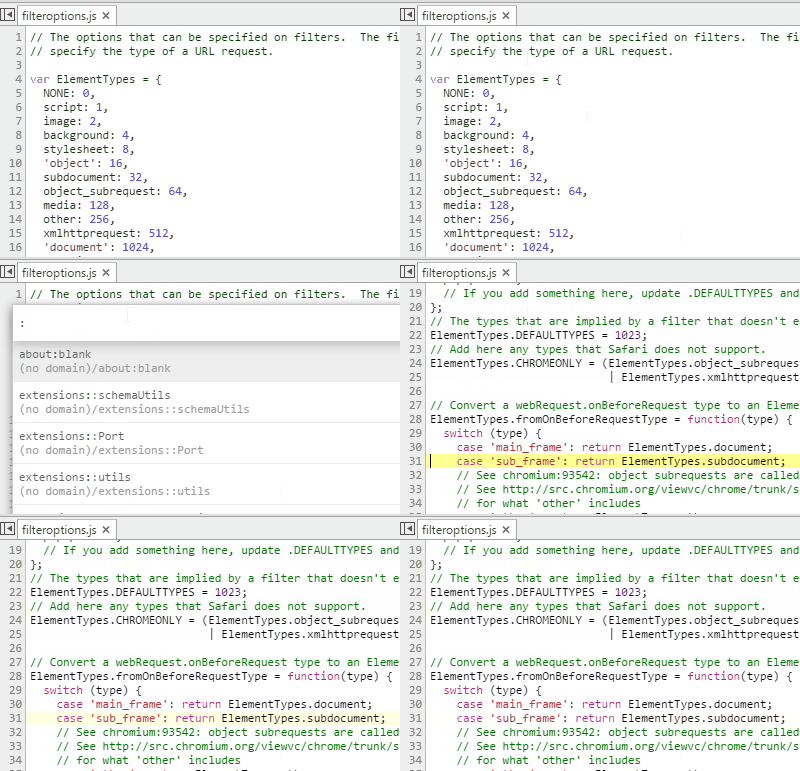
Once you have opened any source file and want to move to a particular line, then press Ctrl + G and give the line number and hit enter.
4. Selecting DOM Elements in the Console tab
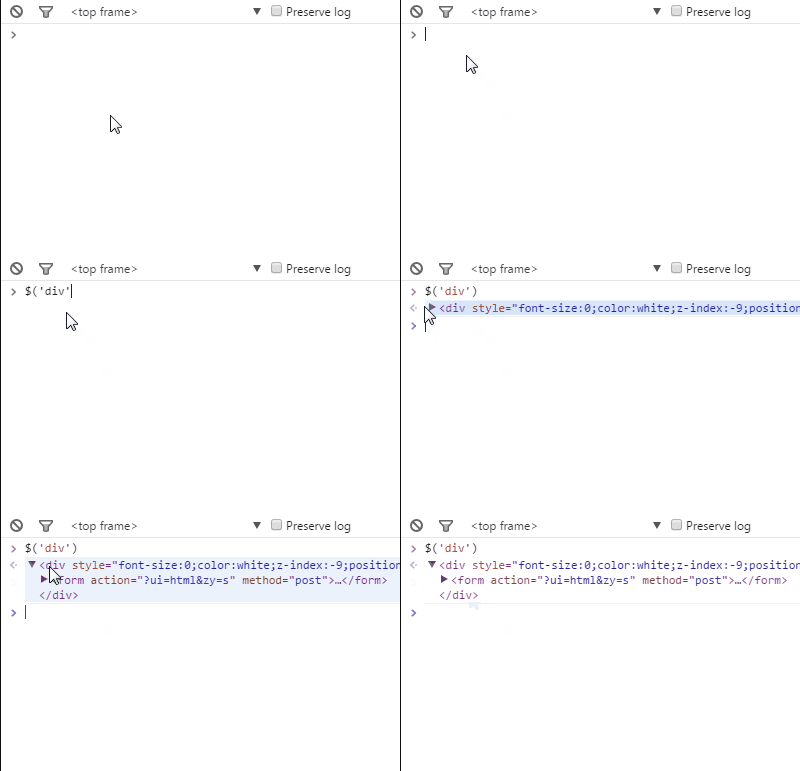
Dev Tools also allows you to select elements in the console.
- $() – Returns the first occurrence of the matching CSS selector.
- $$() – It returns the array of elements matching the given CSS selector.
For more console commands, head over to this post.
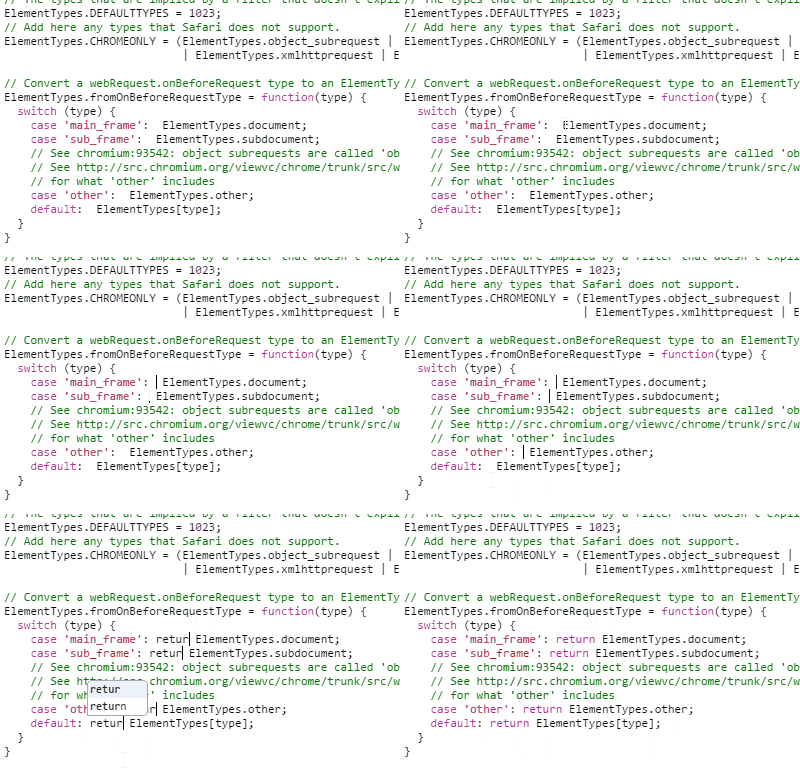
5. Make use of multiple carets
Sometimes, you want to set the multiple carets at different places, and you can do that easily in Chrome Dev tools by holding the Ctrl key and clicking where you want to place them. Then start writing, and you will see that it is placed at various places selected.
6. Preserve Log
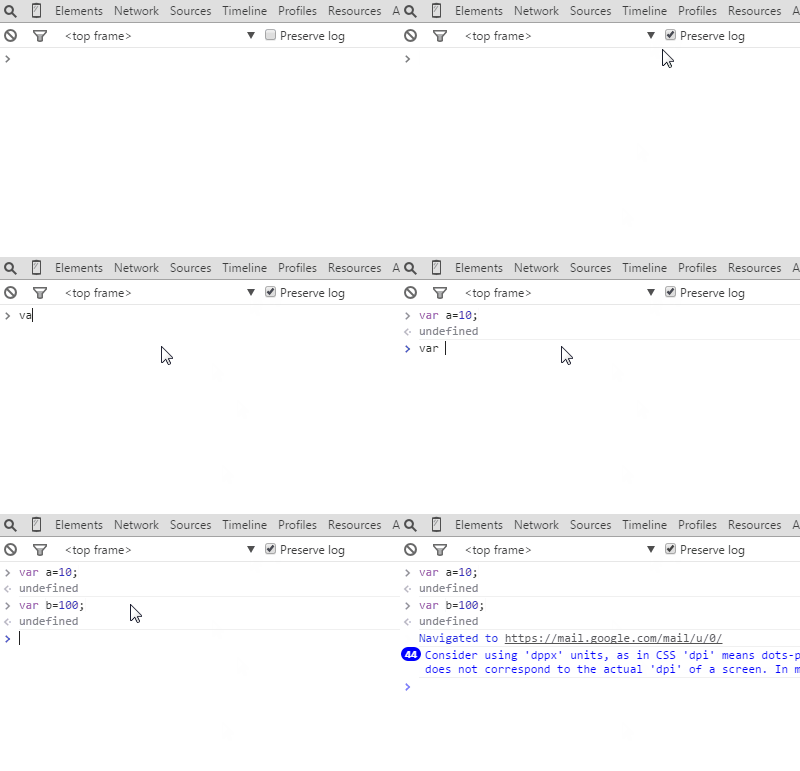
Preserve log helps you to persist the log even the page is loaded. Check the option beside Preserve log in the Console log and the log is preserved. This shows up in the log before the page is unloaded and helpful in investigating the bugs.
7. Use built-in code beautifier
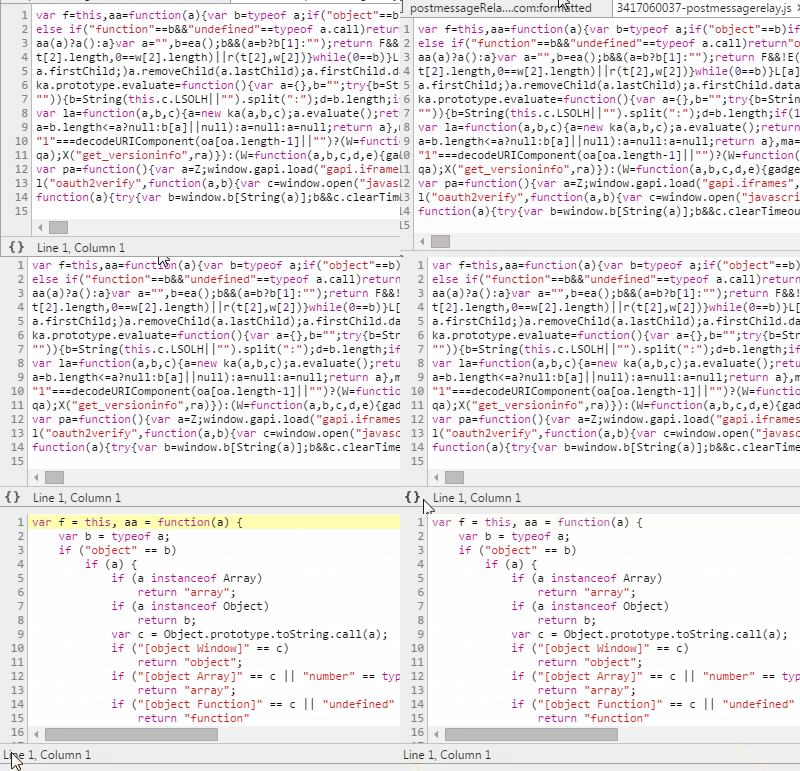
Chrome Dev Tools has the built-in code beautifier called pretty print “{}”. The developer tool shows the minimized code and is not so easy to read. Click on the pretty print button, which is shown on the bottom left on the opened source file, to show the source file in the human-readable format.
8. Is your website mobile friendly? Check it here
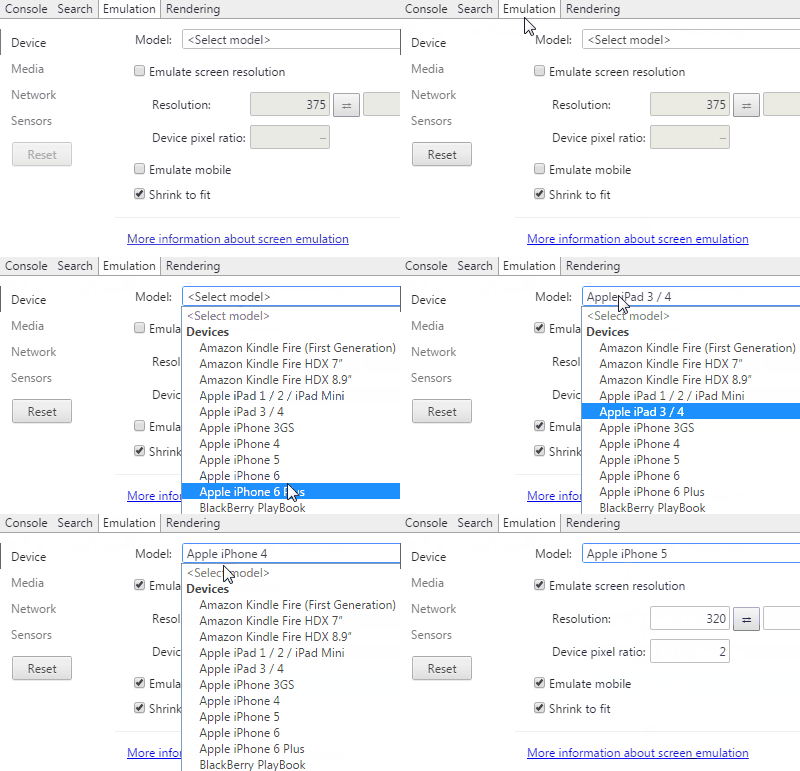
Chrome Dev Tools also allows us to check whether a website is mobile-friendly or not. You can check how your website looks on various devices. Head over to Chrome Dev tools, and under Emulation tab, you can file various devices. Select the device you want and test how your website looks on that device.
For more information, have a look at the following video.
9. Emulate Sensors and Geographical Location
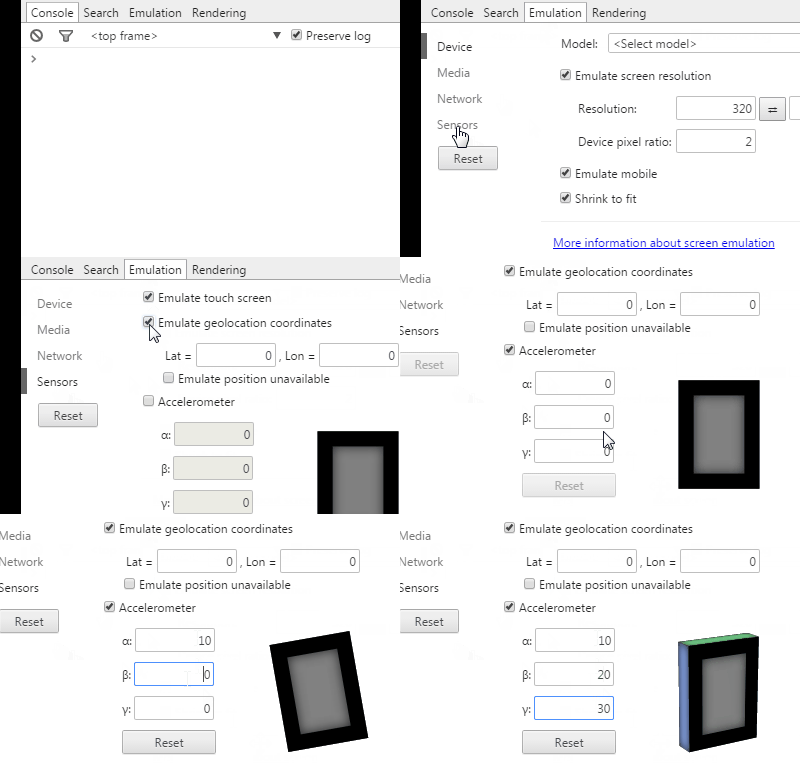
You can even emulate the sensors like touch screens and accelerometers. You can even emulate the geographical location. To do this, head over to Emulation -> Sensors.
10. Select the next occurrence of the current word
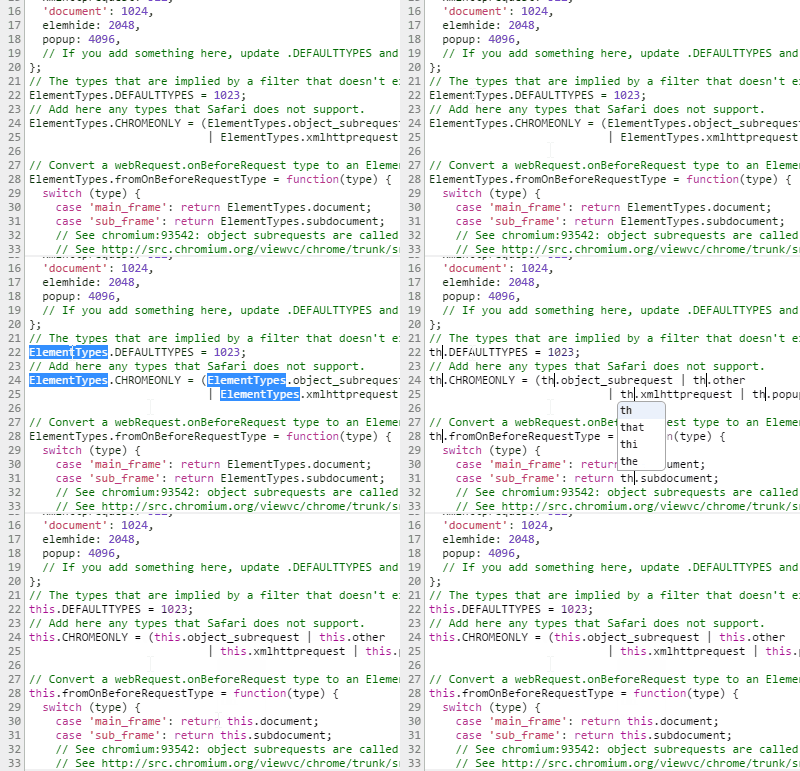
If you want to replace the word In all of its occurrences, then select the word and press Ctrl + D to select the next occurrence of the selected word. Then, you can edit that word in all its occurrences in one shot.
11. Alter Color Format
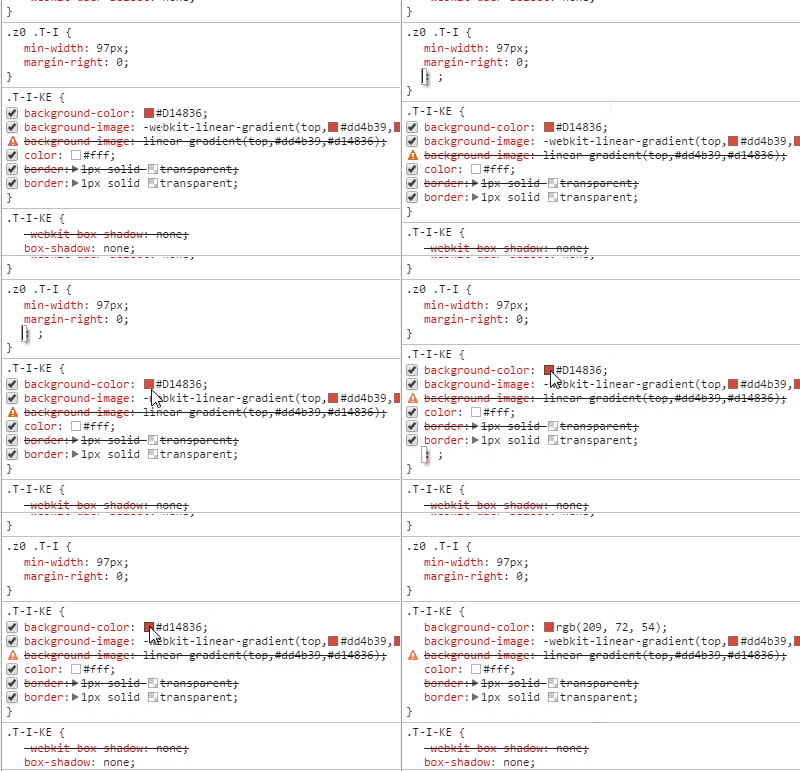
Just use Shift + Click on the color preview to change alters among RGBA, hexadecimal and HSL formatting.
12. Add changes to local files through the workspace
We can edit source files and make some changes in CSS, JavaScript, and other files in Chrome Dev tools. To add these changes to the local files, then there is no need to copy-paste the changes from the workspace to files on disk. Chrome Dev tools allow you to match files and update the local file with your changes in the dev tools. To get this done right click on the source file on the left side on the Sources tab and select Add Folder to workspace.
I hope this helps.
Leave a Reply