Want to know what causes your computer to crash and show Blue Screen of Death (BSoD)? You can use dedicated free software to analyze crash dump reports in Windows 11/10. In this article, I am going to mention the best free crash dump analyzer software that you can use on Windows 11/10.
Whenever your computer runs into an error and crashes, a minidump file (.dmp) is created at a default location i.e., C:\Windows\MiniDump. If not, you can configure Windows to create Crash Dump Files on Blue Screen. These free software read the minidump files and analyze the cause of the crash. You can view the module or driver that possibly caused the blue screen. A detailed report with error code, exception, file information, and more is also displayed in these software. Some software on this list show application and process crash report. You can export the crash dump analysis report in a file to share or view later.
Free Crash Dump Analyzer software for Windows 11/10
Here is a list of free crash dump analyzer software available for Windows 11/10:
- BlueScreenView
- WhoCrashed
- Windbg
- AppCrashView
- WinCrashReport
Find out details on these below!
1] BlueScreenView
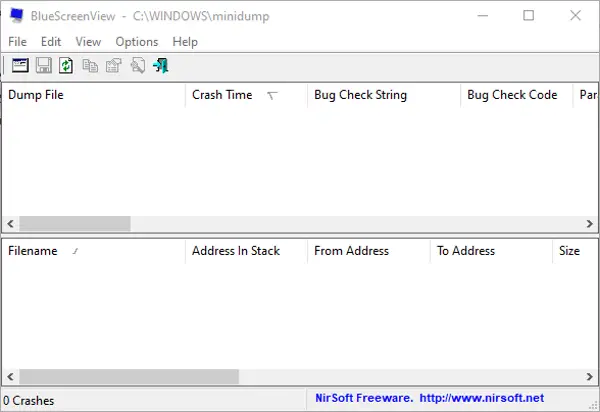
BlueScreenView is a free crash dump analyzer software for Windows 11/10. It is used to analyze BSoD and minidump files. You can view minidump files using it and the reasons that caused your PC to crash. It fetches all minidump files from the default location. You can change this location or browse and import a crash dump file from a custom location.
It shows various information regarding a crash. You can view crash time, the driver that most probably caused the crash, bug check code, crash address, file description, file version, 4 crash parameters, and more. You can export an HTML report of selected or all information related to a crash.
This software comes in a portable package.
Read: What are System Error Memory Dump Files in Windows.
2] WhoCrashed
WhoCrashed is a crash dump analyzer software for Windows 10. You can download its home edition which is available for free.
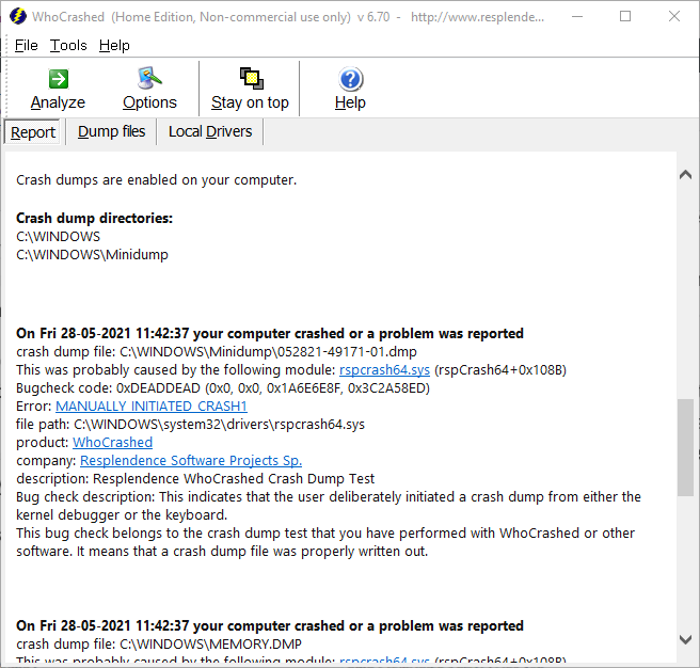
It fetches and loads crash reports from default minidump files’ location. You can start importing all the crash dump files by clicking on the Analyze button. You can select the number of crash reports you want to view using Options. The crash report is shown in the Report tab. You can locate the latest or whichever minidump file you want to analyze and then view the respective information in this section.
It shows crash reports including information like errors, bug check code, bug check description, the module that possibly caused the crash, file path, product, company, and more. It provides a web link to errors, so you can view details about an error on the web. There is also a Conclusion section at the end of the Report tab where a summary of all crashes is displayed along with tips to avoid crashes. You can find a Crash Dump Test feature to manually crash your computer for testing.
It is a useful freeware to analyze crash dump reports. You can even export the report to an HTML document.
3] Windbg
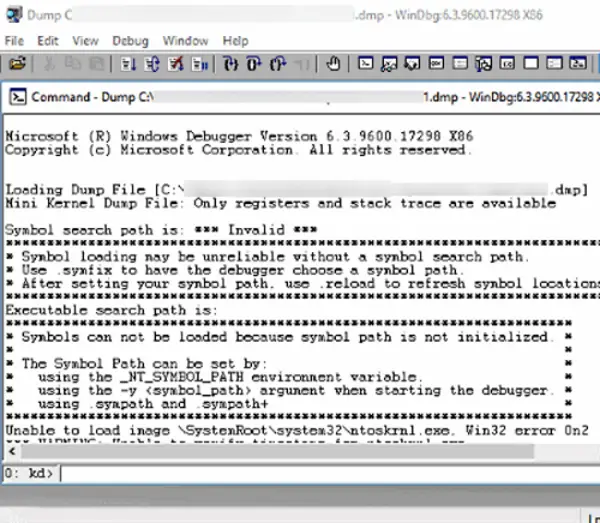
Windows Debugger Tool (Windbg) is another free crash dump analyzer software for WIndows 10. This debugging tool is a part of the Windows Software Development Kit (SDK) package. While installing this package, simply choose the Debugging Tools for Window feature to install, and then you will be able to use it.
You can import a minidump file from your PC by using its File > Open Crash Dump option. There is this button called !analyze -v in the prompt; click on it. It will then display a detailed crash report that includes faulty driver information, exception error, exception code, dump qualifier, faulting IP, failure ID hash string, and more. Overall, it is a good minidump file analyzer for Windows 11/10.
4] AppCrashView
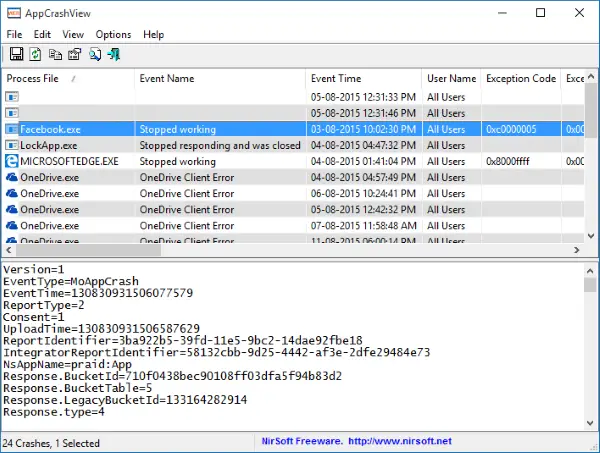
AppCrashView is a crash dump analyzer for applications on Windows 10. It basically shows a dump report for the crashed application using Windows Error Reporting (.wer) files. You can view a list of processes that crashed with information like fault modules and version, exception code, event name, event time, etc. You can click on a process and then view a detailed crash report for the same. The crash report can be saved as a CSV, HTML, TXT, or XML file.
5] WinCrashReport
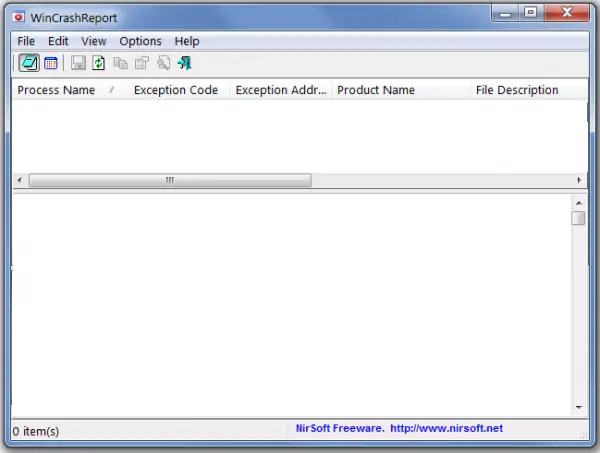
WinCrashReport is a freeware to show reports on crashed processes and applications in Windows 10. You can check which application crashed and why. It displays the crash address, crash code bytes, exception code, exception address, product name, file version, strings in the stack, modules list, full-stack data, etc. Using this information, you can analyze the cause of application crashes.
If needed, you can save the crash report in HTML or plain text file. The good thing is that it is portable and requires no installation. Just run the downloaded application file and view crash reports.
Related reads: