Want to create a Gantt chart in PowerPoint presentations? This article will help you to add a Gantt chart in Microsoft PowerPoint. A Gantt chart is used in project management to visualize and manage the schedule of important tasks and milestones in an effective manner. If you need to add a Gantt chart in your PowerPoint presentations, you can use different methods. In this article, we are going to discuss two different methods to create a Gantt chart in MS PowerPoint. Let’s check out these methods!
How to create a Gantt Chart in PowerPoint
Here are the two methods you can use to make a Gantt chart in PowerPoint on your PC:
- Create a Gantt Chart from Scratch using Stacked Bar Chart
- Use a Gantt Chart Template from Online Library.
Let’s have a look at these methods in detail!
1] Create a Gantt Chart from Scratch using Stacked Bar Chart
You can manually create a custom Gantt chart from scratch using the native Chart menu of PowerPoint. In its Chart menu, you can find several types of standard charts including line, bar, area, pie, etc. To create a Gantt chart, you will need to add a Stacked Bar Chart. Let’s have a look at the steps to make a Gantt chart from scratch:
- Launch PowerPoint and create a blank presentation.
- Go to the Charts menu and add a Stacked Bar Chart.
- Edit the Chart data in Excel with Start time, End time, and total duration.
- Turn the stacked bar chart into a Gantt chart.
- Save the Gantt chart.
Launch Microsoft PowerPoint and create a new blank presentation with a blank slide layout. Now, go to the Insert tab and from the Illustration section, tap on the Chart option. You will see an Insert Chart window from where you can add various types of charts. Here, go to the Bar chart category and choose Stacked Bar Chart.
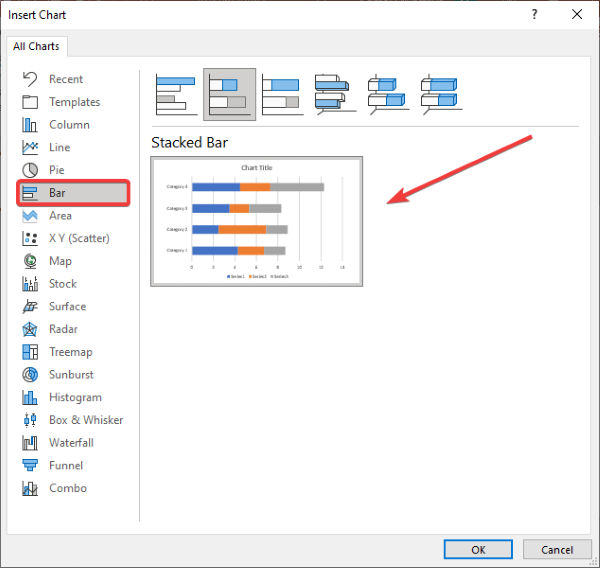
A standard Stacked Bar Chart will be added with an Excel sheet to enter your chart data. Go to the Excel Sheet and add tasks and duration. In the rows, you need to enter tasks. While, name the columns Start Date, Finish Date, and Duration to enter the respective schedule for each task.
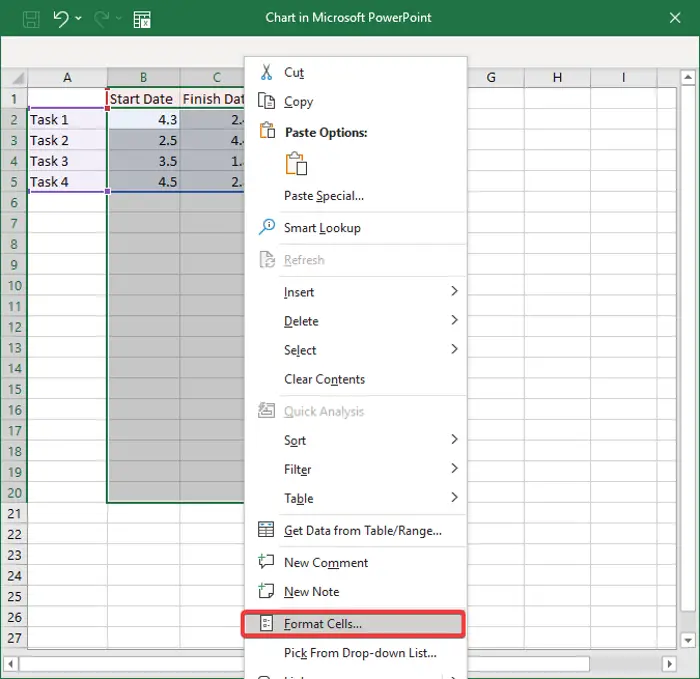
For the Start Date and Finish Date, select the entire columns and right-click on them. Now, from the context menu, click on the Format Cells option.
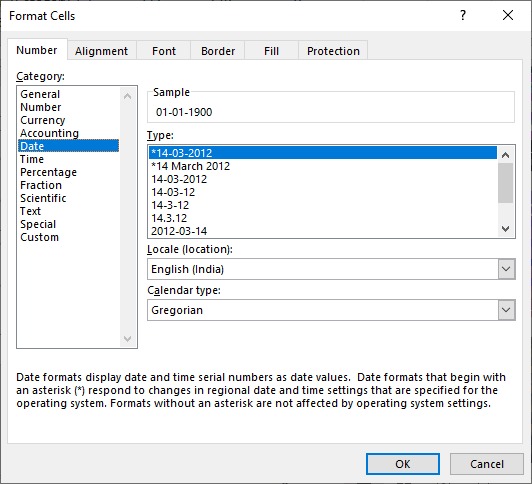
Next, go to the Date category and select the desired date format and click on the OK button.
In the Duration column, enter this formula for each cell: =C2-$B2. This formula will calculate the duration of a task based on the entered start date and finish date. See the below screenshot for your reference.
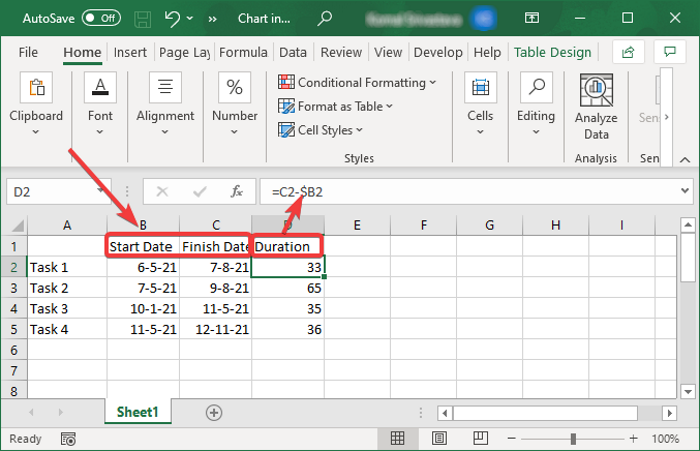
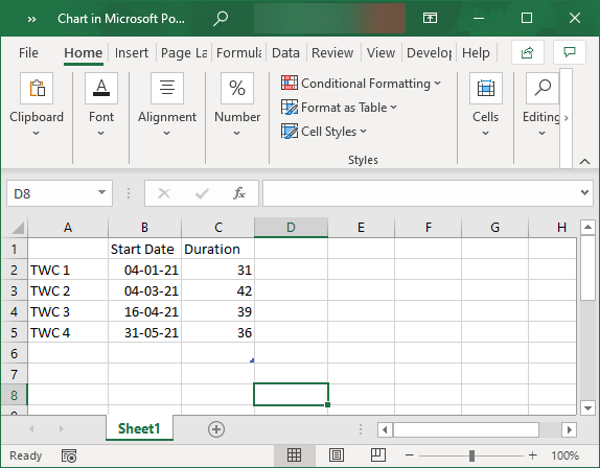
After you identify the duration of each task, copy it to another column. Now, select the Finish Date column and delete it. Then, create a new Duration column and copy and paste the identified duration in it. Your final data will look something like the data shown in the below screenshot.
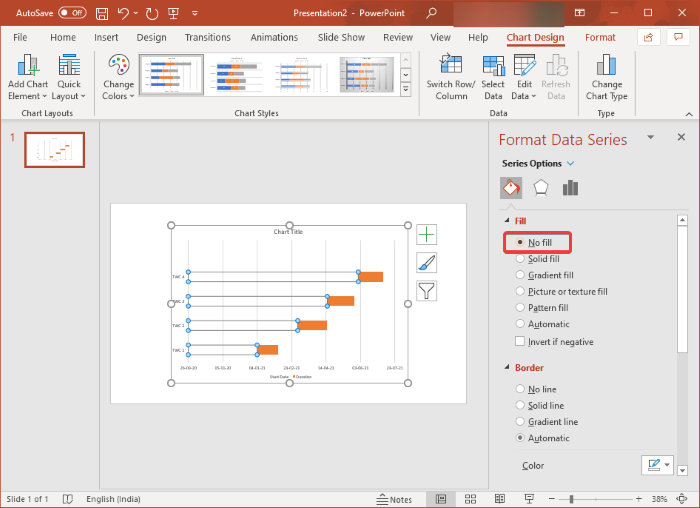
Go to the PowerPoint presentation and select the blue bar. You will see various format options. Select the Fill & Line options and then set the Fill option to No Fill. As you do that, the stacked bar chart will appear as a Gantt chart.
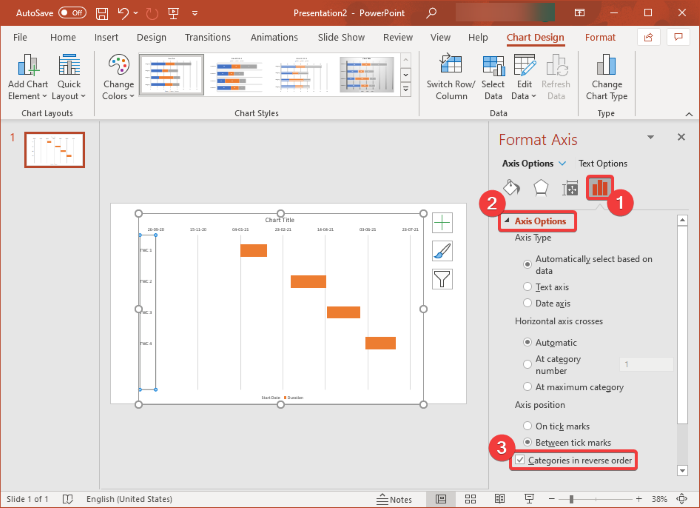
Now, reverse the order of task bars in the Gantt Chart. For that, select the Task axis, and then from the right pane, expand the Axis Options. Scroll down to Axis position text and enable the Categories in Reverse Order checkbox.
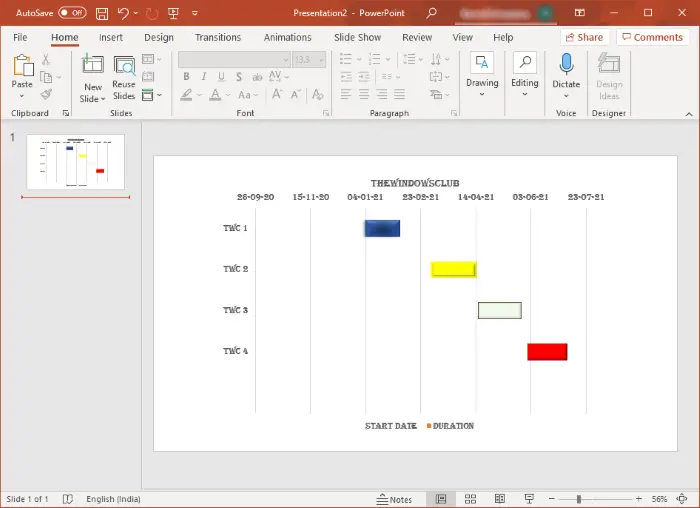
Furthermore, you can customize chart elements, format the text, change the format of bars, change colors for each task bar, customize chart style, insert images and icons, and make other adjustments to create the desired Gantt chart.
When done, you can save the Gantt chart in the format of an image. Right-click on the chart and click on the Save as Picture option and export the Gantt chart in PNG, JPEG, GIF, and more formats.
2] Use a Gantt Chart Template from Online Library
Microsoft PowerPoint provides some good Gantt chart templates that you can browse and import from its online library. Later, you can customize the Gantt chart as per your requirement. Simply follow the below steps to create a Gantt chart in PowerPoint using a template:
- Open PowerPoint and Go to File > New.
- Search for a Gantt Chart template and import it to the presentation.
- Customize the Gantt chart and then save it.
Launch PowerPoint and go to the File menu. Now, click on the New option, and then in the Search box, type Gantt chart and press Enter button. You will see various Gantt chart templates to choose from. Select a Gantt chart template that you want to use and then click on the Create button.
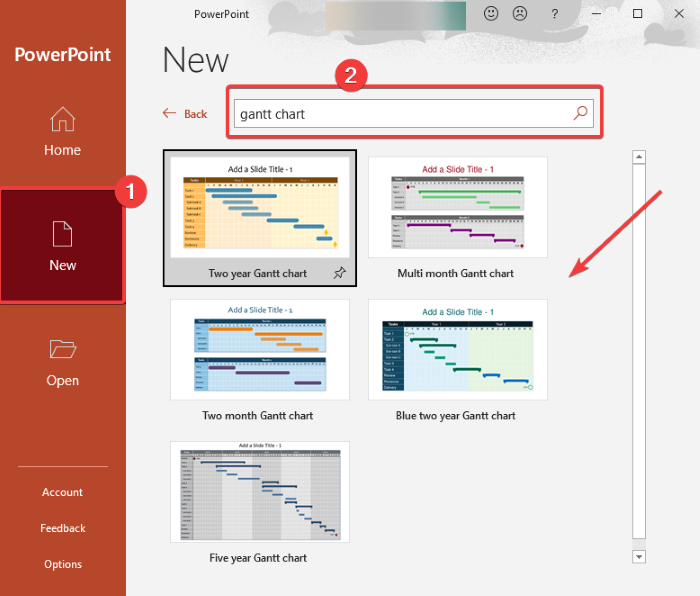
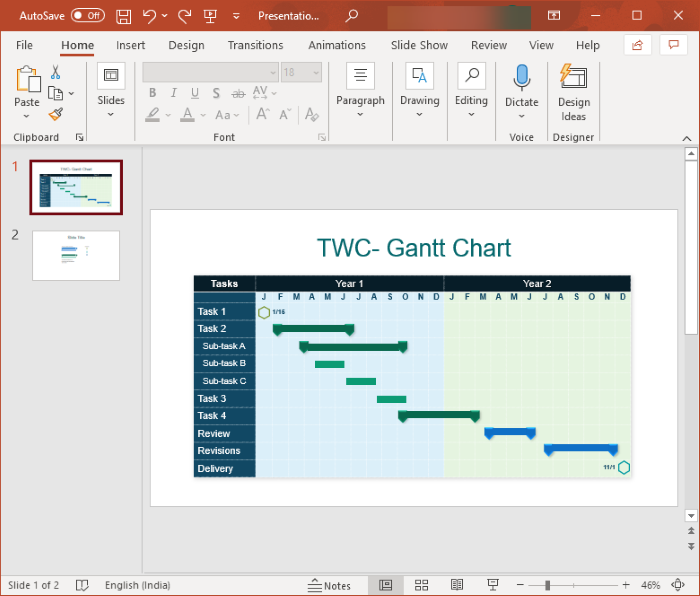
A pre-designed Gantt chart will be added to your PowerPoint presentation that you can modify accordingly. You can add your own tasks, format the text content, adjust the duration of tasks, insert custom images, icons, symbols, media, and shapes, change color theme and style, etc.
Hope this article helps you create a Gantt chart in PowerPoint.
Related reads:
Leave a Reply