Microsoft Excel is a widely used spreadsheet application because of its amazing features. It allows us to use attractive charts to give complete information in an easy way. Sharing an Excel file is what we generally do, but sometimes we want to share only charts we use in the Excel sheets. You may want to use these Excel charts in other Office applications or it might be for any purpose. There may be several ways to do so, but I will let you know about the best and easy way to export Excel charts as images. Read the article to know how it can be done easily – but before that let us see what most of us do to extract charts as images from Excel.
Exporting Excel Charts as Images
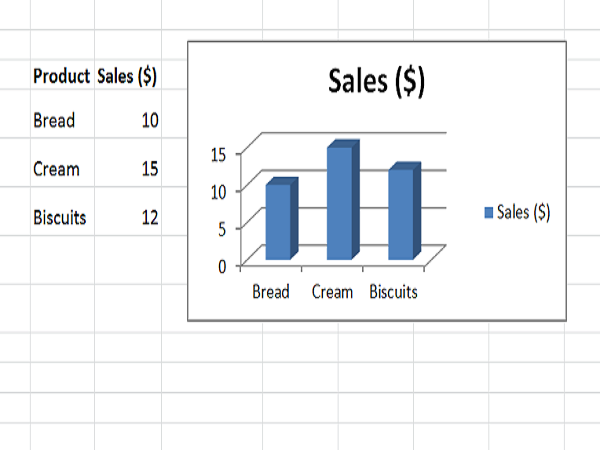
Extract Excel Charts to other Office applications
As discussed earlier one of the use cases was, you want to use the Excel charts in any other Office applications like Microsoft Word or Microsoft PowerPoint.
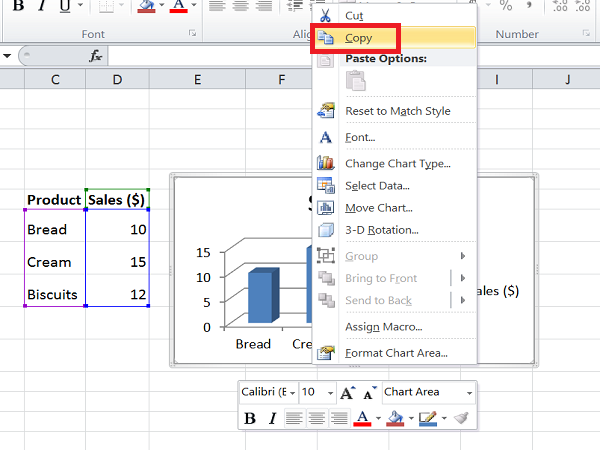
What we generally do is right-click on the end of the chart and select “Copy”. Clicking on the edge makes sure that the entire chart gets selected and not only part of it. Now, the chart gets copied to your clipboard.
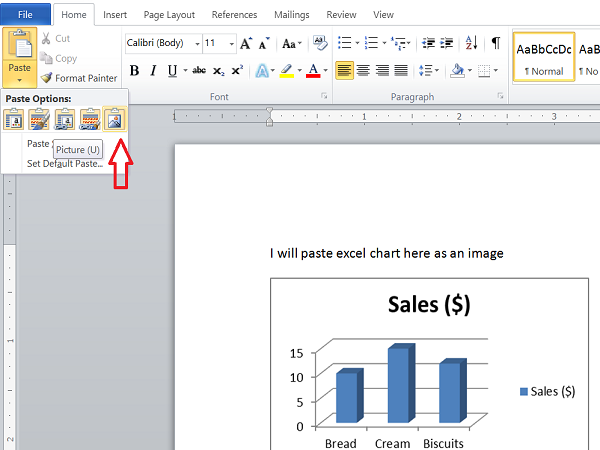
Now, let us say you want to insert it into Microsoft Word. Then, we would open the Word document, click on “Paste” and then click on “Picture” under “Paste Options”. You could see that the Excel chart has been pasted as a normal image in the Word document, and you can resize it even as you need.
It is easy to insert one or two Excel charts as images in other Office applications. But, what if you want to insert several charts as images? This trick does not work in such cases.
Also Read: Advanced Excel Tips and Tricks for Windows users
Use Paint to Save Excel Charts as Images
If you want to extract an Excel chart as an image directly without using it in any other Office application, then Paint would be the best option. You can choose any image editing application, but as Paint is readily available, let us use that.
Copy the chart from Excel as explained above, launch Paint, and press “CTRL+V” to paste the copied chart into Paint and crop it as you want. Now, click
Now, click File > Save As and choose the appropriate image format. Give it a name and save it as an image. Now, you can share this image and use it anywhere you want. But, this also does not look simple if you want to extract
Now, you can share this image and use it anywhere you want. But, this also does not look simple if you want to extract several Excel charts as images.
Convert Excel Chart to Images by saving Workbook as Webpage
The previously discussed two methods will not help if you want to export all Excel charts as images. The easy way to do so is to save the entire workbook as a Webpage. By doing so, Excel will export all charts in the workbook as images, and you can use them right away.
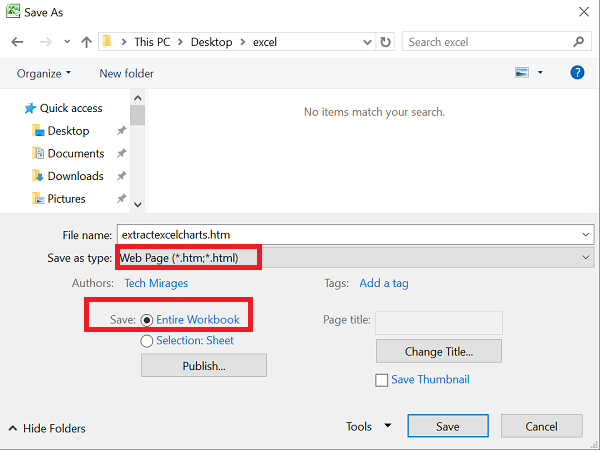
To do so, go to File > Save As. In the ‘Save As’ window, select the location where you want to save the workbook and give it a name. Now, the
Now, the important part is to select “Web Page (*.htm,*.html)” under “Save as type” and make sure that you select “Entire Workbook” under the “Save” option. Click on the “Save” button to save the workbook as Webpage and ignore any compatibility messages.
Click on the “Save” button to save the workbook as Webpage and ignore any compatibility messages.
Go to the location where you have saved this Webpage Archive. You will see the ‘.htm’ file and a folder with the same name with “_files” appended to it.
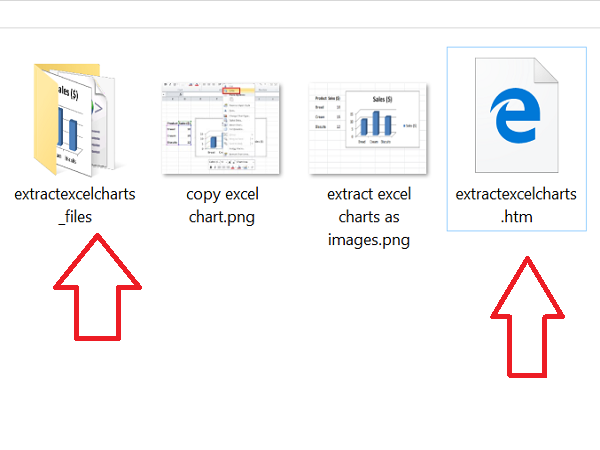
Open this folder and you will see HTML, CSS, and image files. These image files are nothing but charts used in all Excel sheets in the saved workbook. You will see a copy of every image – one is of full resolution, and the other is of reduced resolution so that you can use it in any blog post.
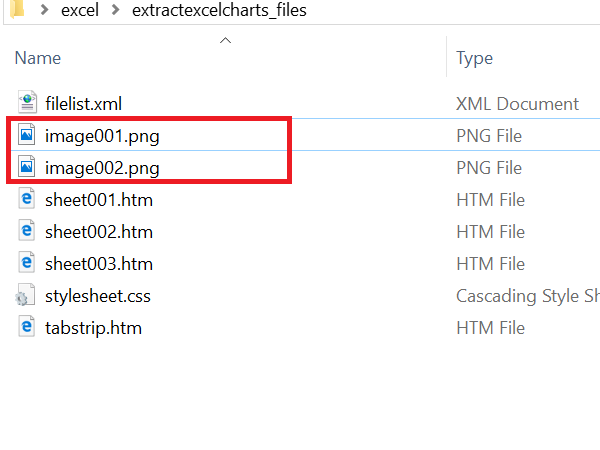
This way of saving the workbook as a web page helps you to export all Excel charts as images in a simple way.
Hope you all liked this simple trick. If you have anything to add, please do share it with us through comments.
Want to see how to share an Excel workbook with multiple users across the web?
How to save the chart as a Picture on MacBook?
All you need to do is right-click on the chart around the borders, and then use Command + C to copy. Then open any other application such as word or any photo editing software, and simply use Command + V to paste it.