SmartArt graphics are a visual representation of your information and ideas. SmartArt graphics are used to communicate your important information by describing processes, hierarchies, and relationships so that your audience can easily understand. Did you know that you can animate SmartArt graphics in PowerPoint? Yes, in Microsoft PowerPoint, users can animate anything using the animation tools offered. In this tutorial, we will discuss how to animate SmartArt graphics in PowerPoint.

How to animate SmartArt graphics in PowerPoint
Follow the steps below to make animated SmartArt in PowerPoint:
- Launch PowerPoint.
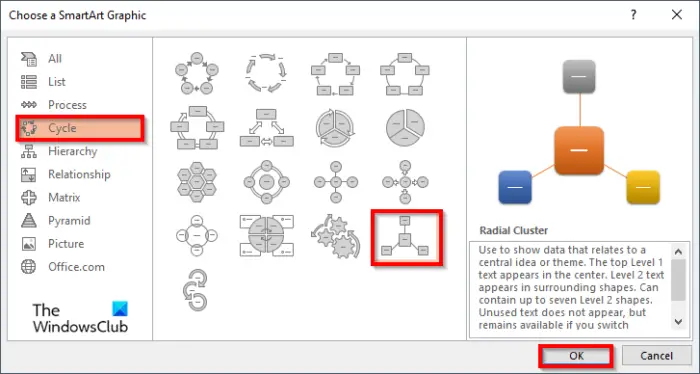
- Click the Insert tab, then click SmartArt.
- Choose a SmartArt, then click Ok.
- Customize your SmartArt diagram.
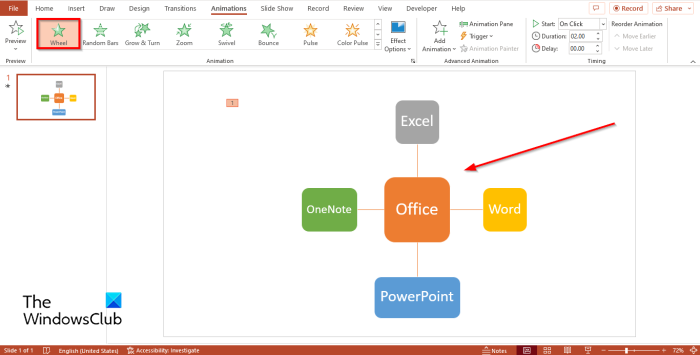
- Click the Animation tab and choose an animation from the Animation Gallery.
- To play the Animated SmartArt, click the Preview button on the Animation tab.
SmartArt is important because it helps to create an organization, process and hierarchy, and stages; it displays information with graphics and values to what speakers are stating about their data.
Launch PowerPoint.

Click the Insert tab, then click the SmartArt button in the Illustration group.
Choose a SmartArt diagram from the dialog box, then click OK.
Customize your SmartArt diagram.
Now we are going to add some animation to the diagram.

Click the Animation tab and choose an animation from the Animation Gallery. In this tutorial, we have chosen the animation Wheel.

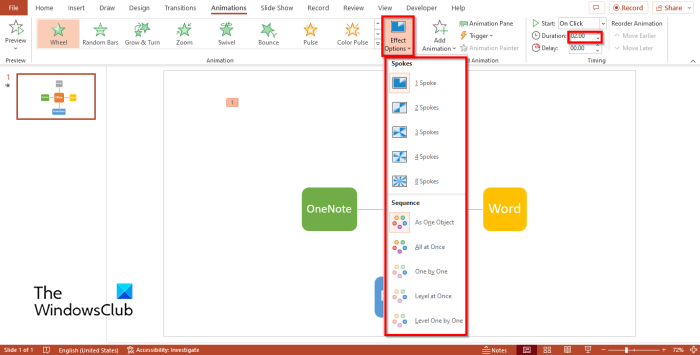
If you want the animation to appear one by one or by spokes, click the Effects Option button on the Animation tab.
Under the Sequence section, you can choose to let the data appear one by one by selecting the One by One option.
You can make your SmartArt looks like it is appearing in pieces by clicking any of the options under the Spoke section.
You can also set the duration time of the animated SmartArt by adding a time in the Duration box.
Click the Preview button on the Animation tab to play the SmartArt graphic.
READ: How to create and insert a Pyramid into your PowerPoint presentation
What are the types of SmartArt graphics?
In Microsoft Office programs such as PowerPoint, Word, and Excel, there are eight types of SmartArt graphics, namely:
- List: An appearance of a bulleted list. The List layout gives your main points visibility and emphasizes their importance.
- Process: The Process layout is used to illustrate steps or stages in a process or workflow.
- Cycle: The Cycle layout illustrates a circular or repetitive process. You can use the Cycle diagram to describe an animal’s life cycle.
- Hierarchy: The Hierarchy layout is normally used to create the Organization chart; it is also used to show family trees or products.
- Relationship: The Relationship layout shows nonprogressive nonhierarchical relationships between parts. An example of a relationship diagram is the Venn Diagram.
- Matrix: The Matrix layout usually classifies information and is two-dimensional.
- Pyramid: The Pyramid layout shows proportional or hierarchical relationships that build upwards. They work well with information that you want to show from top to bottom or from bottom up.
- Picture: The Picture layout is used when you want a picture to convey your message with or without explanatory text.
READ: How to create an Org chart in Microsoft PowerPoint
We hope you understand how to animate SmartArt in PowerPoint.