In this tutorial, we will show you how to convert an Excel spreadsheet to a PowerPoint slide. The Excel spreadsheet is often used along with PowerPoint presentations to produce budget reports, business plans, inventory details, financial reports, project status reports, etc. Microsoft Excel spreadsheet is arguably one of the best tools used for accounting and planning business. We frequently use Excel sheets to analyze data, plan events, plan audits, produce charts, calculate the budget, plan expenditures, etc. To present these analysis reports created from Excel, we mainly use Microsoft PowerPoint to make a professional presentation.

Both the Excel sheets and PowerPoint slides are used side by side and, we often copy the tables and charts from Excel, and paste them into PowerPoint slides to make a slideshow presentation. But, we usually keep updating the Excel tables with new data regularly, and in cases like these, it is inconvenient to change all the tables in PowerPoint slides. This hindrance to updating the changes made in the Excel sheet to the PowerPoint slide can be avoided by linking Excel data with PowerPoint.
How to convert Excel to PowerPoint
Fortunately, Microsoft allows you to use object linking and embedding techniques also known as OLE to link the data from Excel spreadsheet to PowerPoint slides which would automatically update Powerpoint presentations whenever you make changes to Excel worksheet. In this case, the Excel sheet is a source file, and the information from the Excel object is linked to the PowerPoint.That being said, any changes to the source file are reflected directly to the linked objects in PowerPoint. In this article, we explain how to copy the data from an Excel worksheet and put it into a PowerPoint presentation with integrated controls.
Copy and paste Excel data in PowerPoint
You can copy the data tables from the Excel spreadsheet and paste them into your PowerPoint presentation. However, the data in PowerPoint is not updated automatically when the spreadsheet data is changed or updated.
Open Excel file you want to copy and select all the data in the file that you want to copy by dragging over the area of the data that you want.
Go to Home tab and click Copy.

Now open Microsoft PowerPoint and open the slide presentation where you want to paste the spreadsheet data.
Right-click on the slide and select the Paste option from the drop-down menu.
You can change the presentation options by clicking on the clipboard icon.
Once done, click Save to apply changes.
Link an Excel worksheet to PowerPoint
Linking an Excel spreadsheet to the PowerPoint will insert all the contents of the file as an object into your PowerPoint presentation.
Open Microsoft PowerPoint and go to Insert tab
Click Object under the Text section.

The Insert Object dialogue box pops up. Click on the radio button with option Create from file.

Click the Browse button and select the Excel spreadsheet whose data you want to link to the Powerpoint.
Select the Link box and click Ok.

Resize the spreadsheet snapshot in the slide and double click on the spreadsheet to open the file in Microsoft Excel.
Link a section of data in Excel to PowerPoint
Launch Microsoft Excel and open the spreadsheet that you want to link to PowerPoint.
Select the data you want to insert into the PowerPoint slide by dragging over the area of the data.
Go to the Home tab and click Copy.
Launch PowerPoint and open the PowerPoint slide where you want to insert the data.
Go to the Home tab and click on the arrow beside the Paste option.
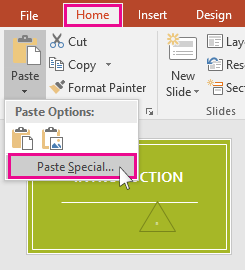
Select Paste Special.
In the Paste Special dialogue box, click on the radio button with the option Paste Link and under Paste Link As, select Microsoft Excel Worksheet Object and click Ok.

It is worth mentioning that the above OLE technique will not work if the Excel source file is renamed or if you move the source file from the original location, as the link won’t be able to search the file.
How to convert data to graph in PowerPoint?
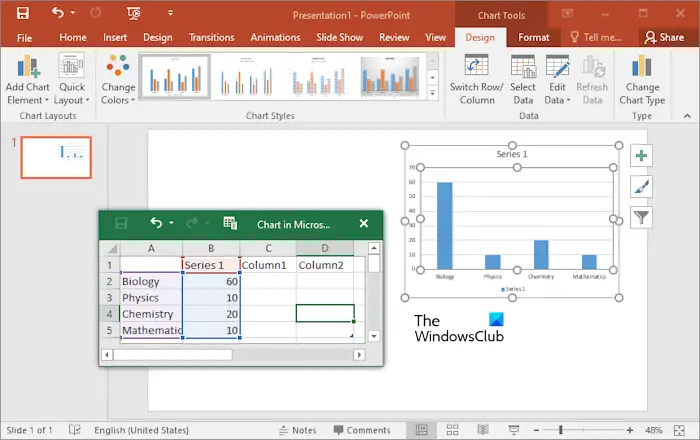
You can easily convert data to graph in PowerPoint. To do so, open PowerPoint and go to “Insert > Chart.” After that, a chart will be inserted into the selected slide and Microsoft Excel will be opened automatically containing the default data. You have to replace this default data with the actual data by using the copy-paste method.
Can you export Excel to image?
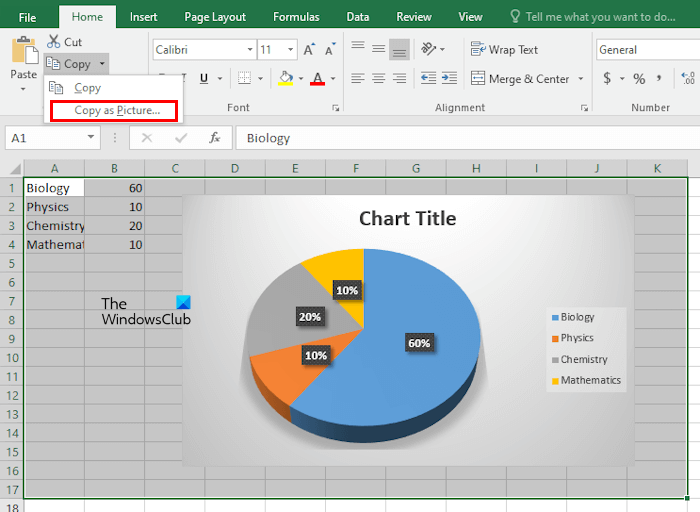
Yes, you can export Excel data to image. There are multiple ways to do that. Select the data in Excel that you want to export into an image, then click on the drop-down arrow next to the Copy option under the Home tab. Now, select the Copy as Picture option. The selected data in Excel will be copied to your clipboard as an image. Now, you can paste it into any image editing software like Microsoft Paint to save it as an image on your PC. Another method to do this is to use third-party tools to convert Excel into images.
That’s all.
Read next: How to add Videos and Bullet Points to PowerPoint.
Leave a Reply