When inserting charts into a Word, you can go to insert and click the chart button and select a chart from the chart dialog box. An Excel spreadsheet will open where you can edit the data that you want to place in the chart, but what if you want to create a chart with the data in an existing table on your spreadsheet? In this tutorial, we will explain the procedure of how to convert a table to a chart in Microsoft Word.

How to convert Table to Chart in Word
Launch Microsoft Word.
Create a table consisting of data or use an existing table consisting of data.
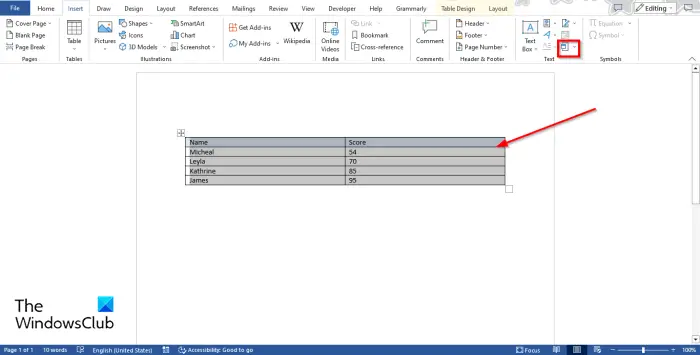
Now highlight the table and then go to the Insert tab and click the Object button.
An Object dialog box will open.
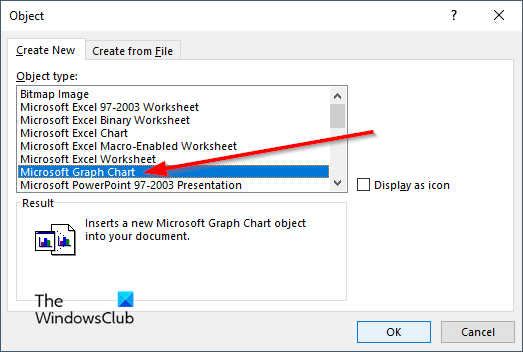
Scroll down and select Microsoft Graph Chart, then click OK.
A chart of the table data will appear along with a Microsoft Graph window where you can edit the graph.
Close the Microsoft Graph Window if you do not want to edit the chart.
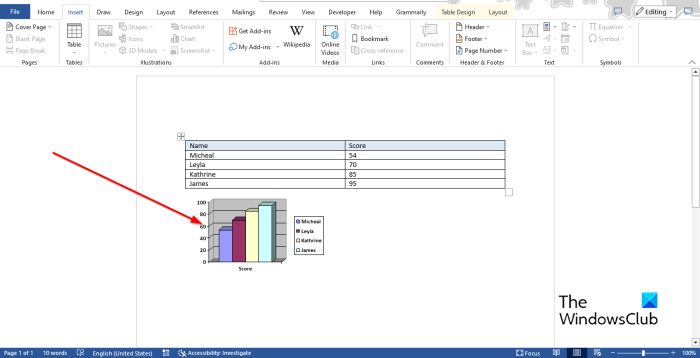
Now we have a chart consisting of data from the table.
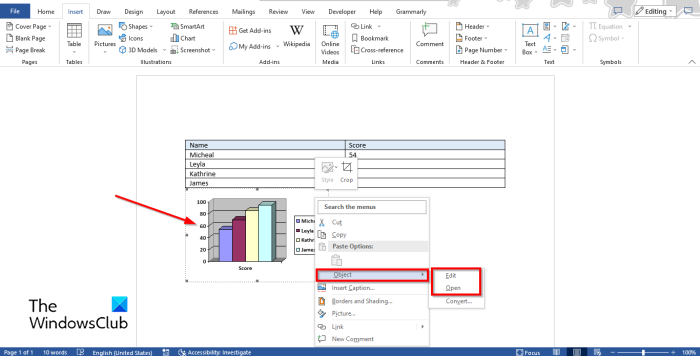
To edit the chart, right-click the chart and hover the cursor Object and select Edit or Open from the menu.
The Microsoft Graph window will open.
Click on the spreadsheet to make changes.
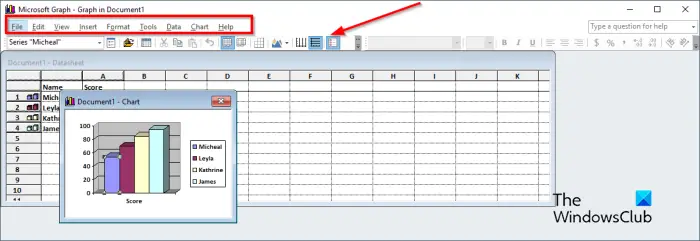
On the Menu toolbar of the Microsoft Graph Window, there are nine tabs, namely File, Edit, View, Insert, Format, Tools, Data, Chart, and Help.
- The File tab: Consists of the feature to update your changes.
- The Edit tab: Consists of the features to Cut, Copy, Paste, Clear, Delete, and Import data.
- The View tab: Consists of features to Switch to Datasheet, Zoom, and insert Toolbars.
- The Insert tab: Consists of the feature to insert cells on the spreadsheet.
- The Format tab: Consists of the features to customize the font, and number, change the Placement, and the Column width.
- The Tool tab: Consists of the Options feature.
- The Data tab: Consist of the features Series in rows, Series in columns, include row and column, and exclude row and column.
- The Chart tab: Consists of the features, Chart type, Chart Options, and 3-D view.
- The Help tab: Consist of feature Help and About Microsoft Graph.
The Standard toolbar consists of tools that offer you quick editing of your graph, such as Format Data Series, Import File, View Datasheet, Cut, Paste, By Row, By Column, Data Table, Chart Type, Category Axis Gridlines, Value Axis Gridlines, and Legend.
Change Pattern, Shape, Data labels, Gap width, Gap depth, and Chart depth
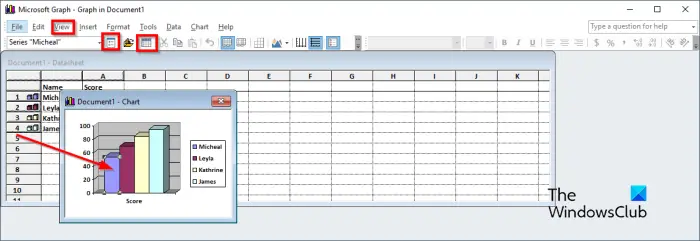
To change the Pattern, Shape, Data labels, Gap width, Gap depth, and Chart depth. Firstly, go to the View tab and select Datasheet or click the View Datasheet button. The chart will appear. select a bar from the chart, then click the Format Data Series button. The Format Data Series allows users to customize graphs or charts.
A Format Data Series dialog box will open.
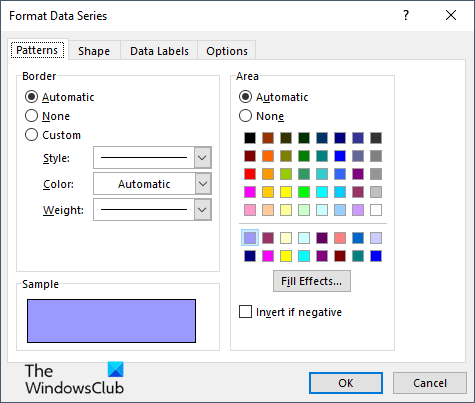
- If you want to change the border and color of the bar on the graph, click the Pattern tab.
- If you want to change the shape of the bar, click the Shape tab.
- If you want to customize the Data Labels, click the Data Labels tab.
- If you want to change the Gap width, Gap depth, and Chart depth, click the Options tab.
Change Chart type
Now to change the chart type, follow the steps below:
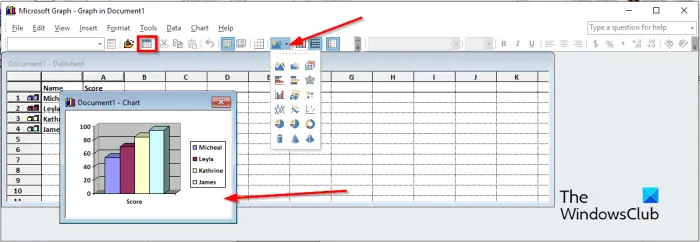
- Go to the View tab and select Datasheet or click the View Datasheet button. The chart will appear.
- Select the chart.
- Then click the Chart Type button and choose a chart type from the menu.
That’s all!
We hope you understand how to convert a table to a chart in Microsoft Word.
How do I switch columns and rows into charts in Word?
If you have inserted a regular chart in the Word document, in order to switch from rows to column, select the chart then go to the Chart Design tab and click the Switch Row/ Column button.
READ: How to sum a Column or Row of Numbers in a Word Table
How do I turn a Table into a Pie chart?
In Microsoft Word, if you have converted a table to a chart and you want to convert the chart to a pie chart follow the steps below.
- Right-click the chart and hover the cursor Object and select Edit or Open from the menu.
- The Microsoft Graph Window will open.
- Go to the View tab and select Datasheet or click the View Datasheet button.
- The chart will appear to make changes.
- Then click the Chart Type button and choose the Pie Chart format from the menu.
- The chart is converted to a pie chart then close the Microsoft Graph Window.