Illustrator is not only for creating vector graphics and images, you can also create graphs. The graphs in Illustrator can be used for presentations and infographics. You can make tweaks to the graphs to make them look more attractive. Learn how to create 3D exploding pie charts in Illustrator to make your pie charts even more attractive.
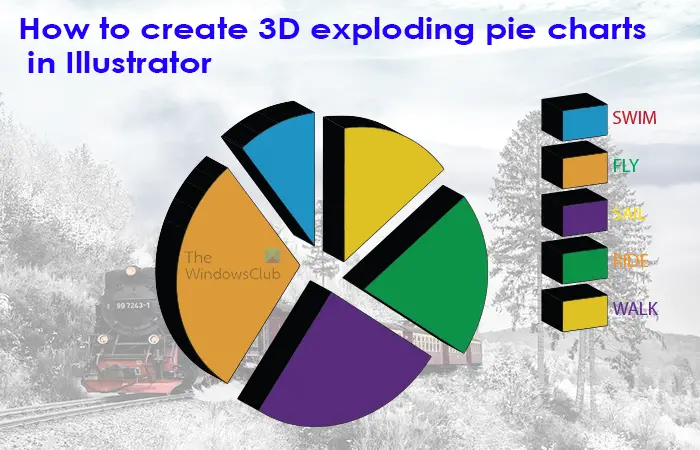
Exploding pie charts add interest to your presentation or infographics. There are two ways to add interest to your pie chart. Infographics and presentations need to look interesting to keep the audience engaged.
How to create 3D Exploded Pie Chart in Illustrator
We will show you the regular 3D exploding pie chart and then add another element to enhance 3D exploding the pie chart. The steps involved are:
- Open and prepare Illustrator
- Create the pie graph
- Add the data to the pie graph
- Change color
- Move slices apart
- Add 3D extrude effect
- Edit the graph data
1] Open and prepare Illustrator
Open Illustrator by clicking the icon.
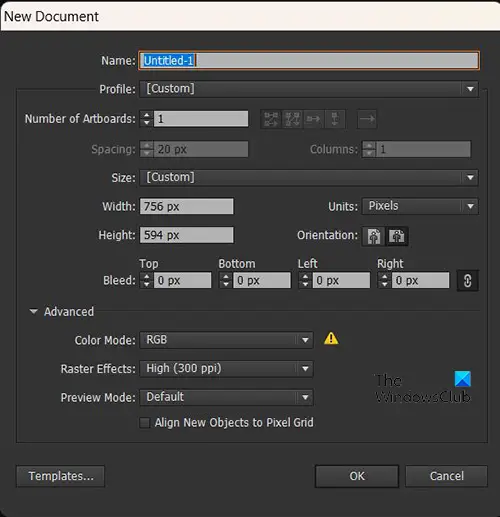
When the New document options window appears, choose the options that you want for the document then press Ok to create the document. With the blank document created, it is time to create the pie chart.
2] Create the pie chart
This is where you will create the pie chart. The pie graph created will be flat so you will have to follow the article to see how to make it a 3D pie chart.
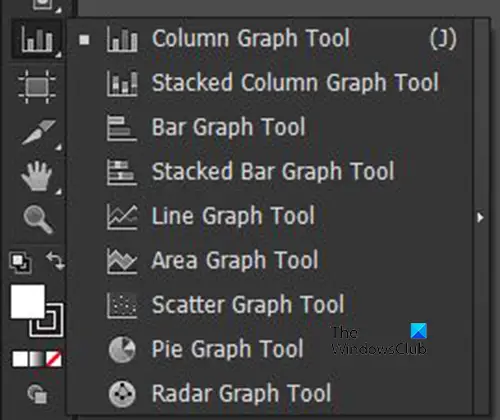
To create the pie graph go to the left tools panel and click on the Pie chart tool. If the Pie graph tool is not showing, long press whatever graph is at the top to bring out the menu. There you will see a list of all the graphs, click on the Pie graph to select it.
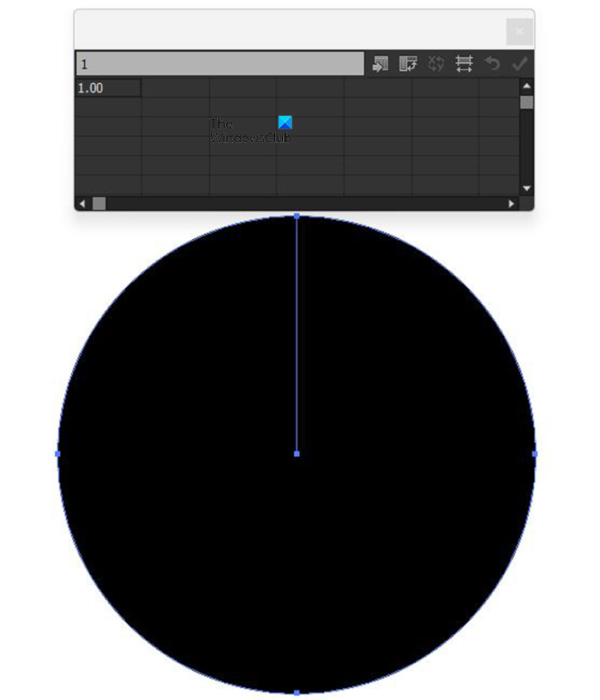
With the Pie graph tool selected, click on the canvas and drag to create the graph. The Pie graph will be created with the table for the data. Since there is only one piece of data in the table, the Pie chart will just be one big unsliced pie.
You can also create the pie graph by clicking on the Pie graph tool and then clicking on the canvas. You will see a window appear for you to enter the Pie graph Width and Height values. When you enter the values press Ok to create the Pie graph.
3] Add the data to the pie graph
With the blank pie graph created, it is time to add the data. You would add the data to the table and it will be reflected in the pie graph.
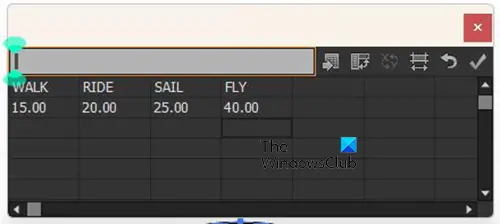
Add the words for the legend that will represent each slice of the pie graph. Add the words to the first row. You then add the corresponding numbers under each word in the second row.
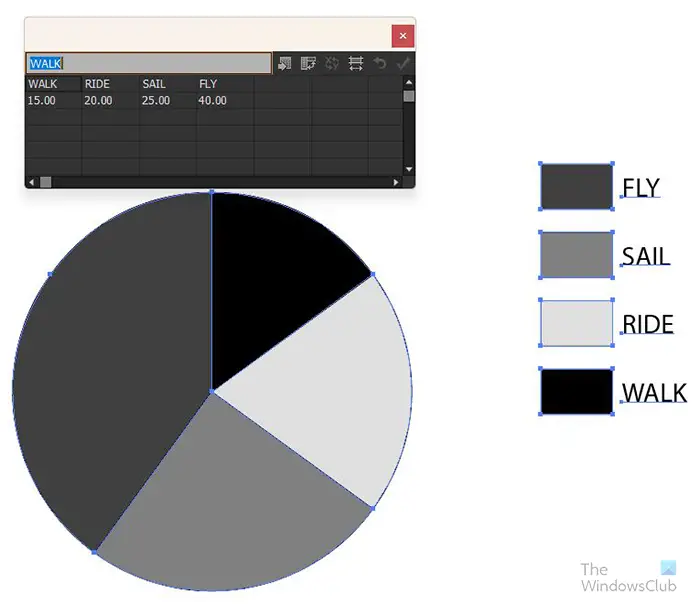
When you are finished entering the data, click the Apply (tick) button to place the data on the Pie graph. You will see the data and legend appear on the pie graph. You will notice that the pie graph is flat and all in one. The next step is to make it #d and appear to be exploded.
4] Change the color of the pie graph
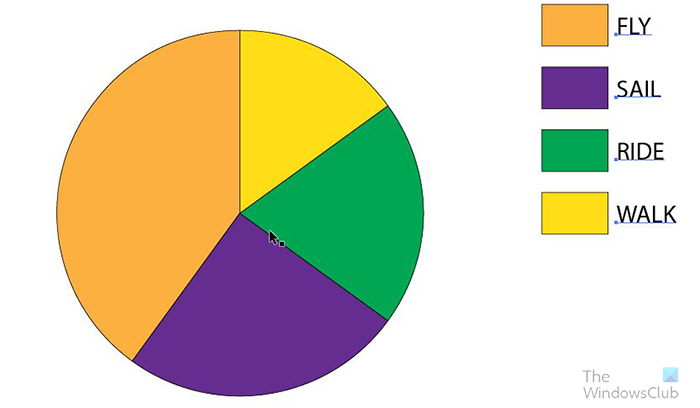
Before adding the other effects you should change the color of the pie graph. To change the color of the pie graph, you would click the Direct selection tool in the left tools panel and select each element that you want to change. When the element is selected, click the color swatch to add the color.
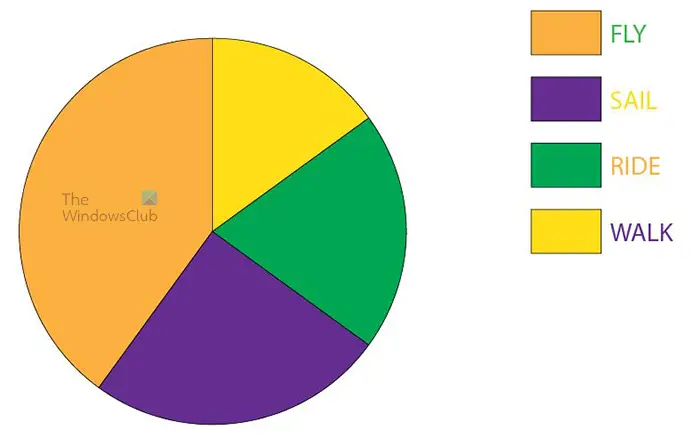
You can change the color of the words or leave them as they are. If you decide to change the color of the words, you would use the same Direct selection tool to select each word or all of them. If you choose to make each a different color you would use the Direction tool to select each then choose the color. If you want to make all the words the same color, click the Direct selection tool then drag around all the words and select them. When the words are selected, choose the color you want.
5] Move slices apart
Now that the pie graph is made and color added, it is time for the exploding effect. To make the pie slices seem to be exploding, use the Direct selection tool to move each slice away from the rest. Move to a distance that you are comfortable with.
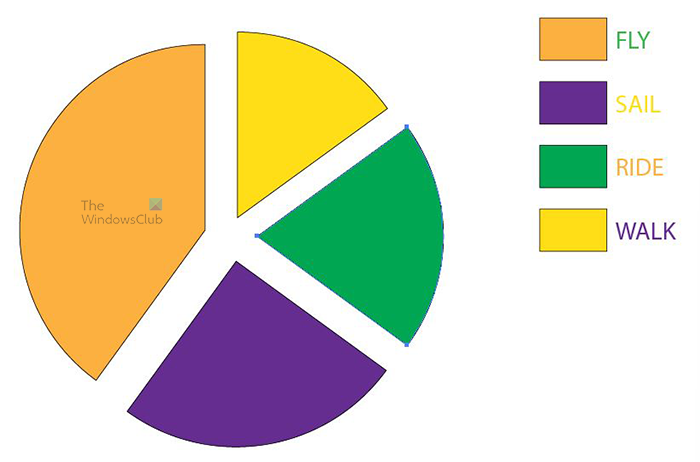
To make the pieces move away more accurately, click each with the Direct selection tool then use the keyboard’s direction keys to move the pieces in the direction that you want.
6] Add 3D extrude effect
This is where you will add the 3D effect to the pie graph. You will click the Direct selection tool and then drag around the pie graph excluding the legend and words. If you like you can add the 3D effect to the legend and words as well. However, in this article, the 3D effect will be added to the pie and the color swatches of the legend.
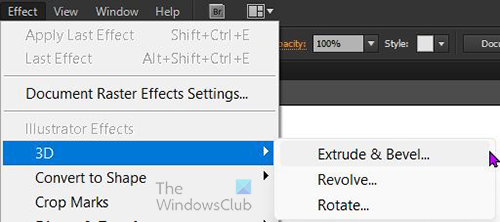
With the parts of the graph that you want to make 3D selected, go to the top menu bar and click Effect then 3D then Extrude & Bevel.
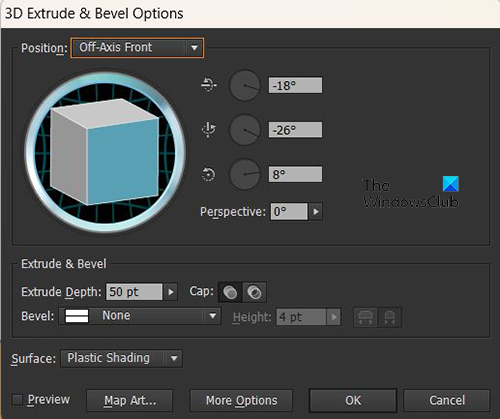
The 3D Extrude & Bevel options will appear for you to make the selections that you want for the 3D pie graph. Check the Preview option to see the live changes happening on the pie graph as you select the options. when Preview is checked, you will immediately see the changes on the Pie graph.
You can adjust the 3D square that you see and that will change the 3D angle of the Pie graph. Just hold the 3D square and adjust it to the angle that you want.
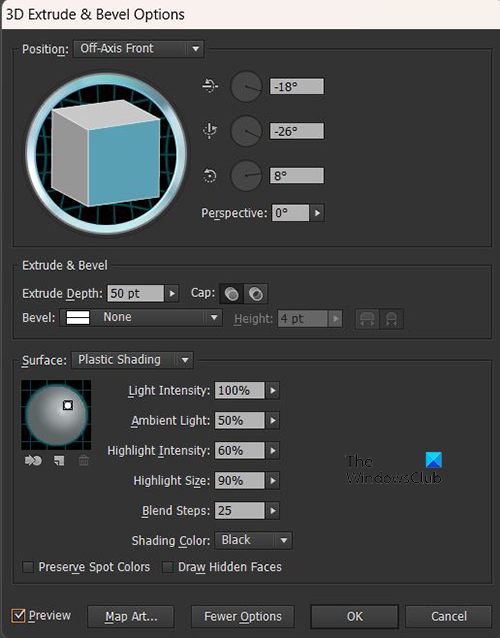
You can see more options for the 3D Extrude by clicking More options and you will see the window extend to show more options.
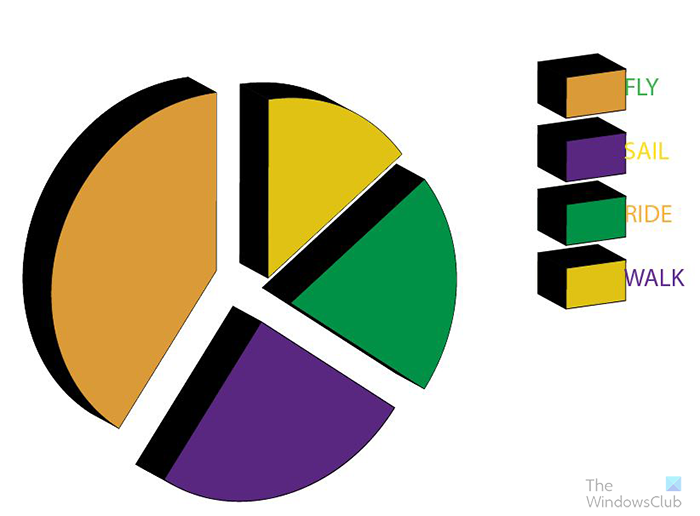
This is what the Pie graph looks like when you are done. You will see that the words are blending into the legend colors because the 3D changes the angle so that they lean into the words. You can change that by using the Direct selection tool to select the word and move them away. To make sure that the words are equal distance apart use a certain amount of taps on the direction key for each so that they are evenly spaced away from the legend colors.
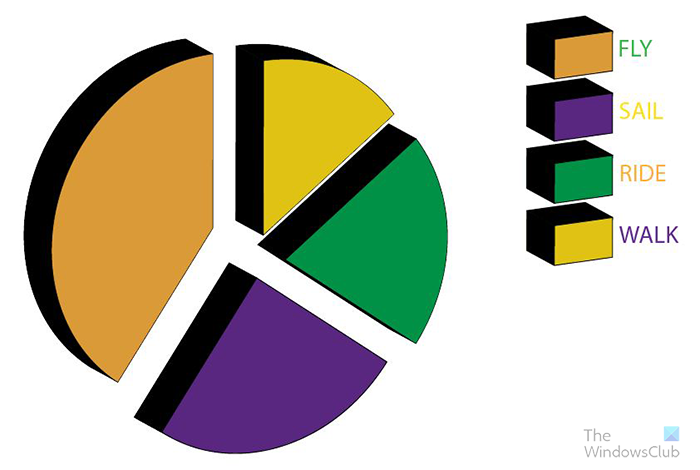
This is what the Pie graph looks like with the words evenly spaced.
Now that the exploding graph is finished, you can tweak any aspect of it to fit your project. If you need to edit the data to change the graph, you can do so easily. To change the data right click on the graph and when the menu appears click Data. When you click Data you will see the data table for the graph. You can change the words and the numbers or both. When you have made the edits or added new data, press Apply (tick) to see the changes in the graph. You then close the data window to show the graph alone.
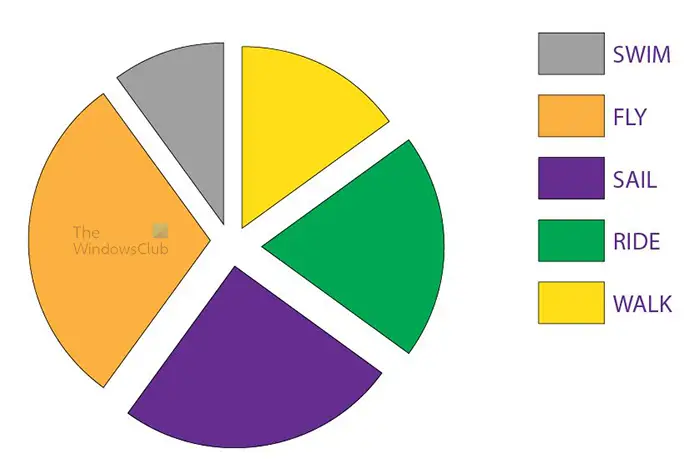
You will notice that the pie graph goes back to being flat after you have applied the new data. Also, the new slice added to the pie goes back to the basic color. You can use the direct selection tool to select this slice and change the color.
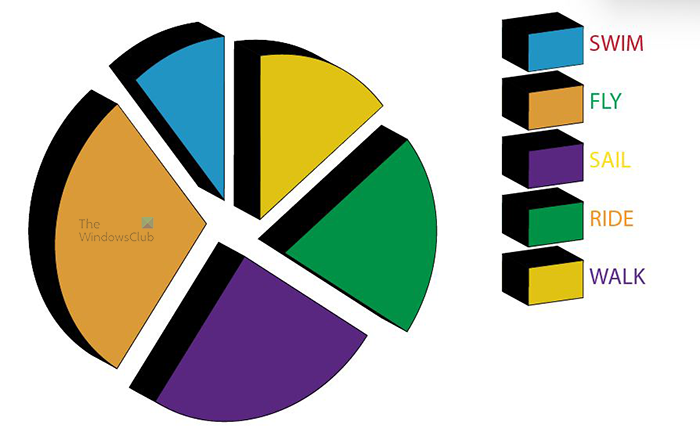
To get it back to being 3D, just follow the steps at point six (6). You should get it back to being 3D. To avoid having to do that all over, be sure that you have all the data that you need and enter them before you make the graph 3D.
When the graph is created, you can make it look more interesting by adding Gradients instead of color. You can add other effects to make it stand out and attract viewers. You can also add the heading to it so that the viewer knows what the chart is all about. Keep exploring the options available so that your pie graph can look interesting.
This is the exploding pie chart with a heading and background image.
7] Edit the graph data
To edit the data and have it reflected on a pie graph that is already created, right-click on the pie graph then select Data. The date window will appear for you to enter new data or edit the previously entered data. When you are finished entering new data or editing the old data, press the Apply (tick) button to update the pie graph.
Edit the legend words without going into the data window
You can edit the words at the legend without going into the data mode. You just go to the word that you want to change then double-click on it and you will be able to edit the word. The change in the word will not be reflected in the data window if you should go to data mode after editing the word.
Read: How make a spinning 3D Globe animation with Illustrator and Photoshop
How do you make a 3D graph in Illustrator?
Making a graph 3D in Illustrator is quite easy to do and remember and the steps are listed below.
- Create the graph and add the data
- Select the graph but not the words (if you do not want the words to be 3D)
- Go to the top menu bar and click Effects then 3D then Extrude & Bevel
- The 3D Extrude & bevel options window will appear
- Check the Preview option to turn it on so that you can see changes on the graph as you make changes in the options window
- Make the necessary adjustments in the 3D Extrude & bevel options window then press Ok to apply the changes. The graph will now be 3D
How do you change a pie chart to a 3D pie chart?
- Create the pie chart by clicking the Pie graph tool and drawing it on the canvas. Add the data into the data window the apply the changes to the chart.
- With the pie chart created, select the pie chart elements.
- Go to the top menu bar and click Effects then 3D then Extrude & Bevel
- The 3D Extrude & bevel options window will appear
- Check the Preview option to turn it on so that you can see changes on the graph as you make changes in the options window
- Make the necessary adjustments in the 3D Extrude & bevel options window then press Ok to apply the changes. The graph will now be 3D.
Leave a Reply