Bar graphs are graphical representations of statistical data in the form of strips or bars. This allows viewers to understand the difference between the various parameters of the data at a glance rather than pointing out and comparing each data set. If you wish to create a bar graph in Excel, read through this article.
Bar graphs in Excel are a form of charts and are to be inserted similarly. Bar graphs could be both 2-dimensional and 3-dimensional depending upon the type of Excel editor you use.
How to create a Bar Graph in Excel
To create a bar graph in Excel:
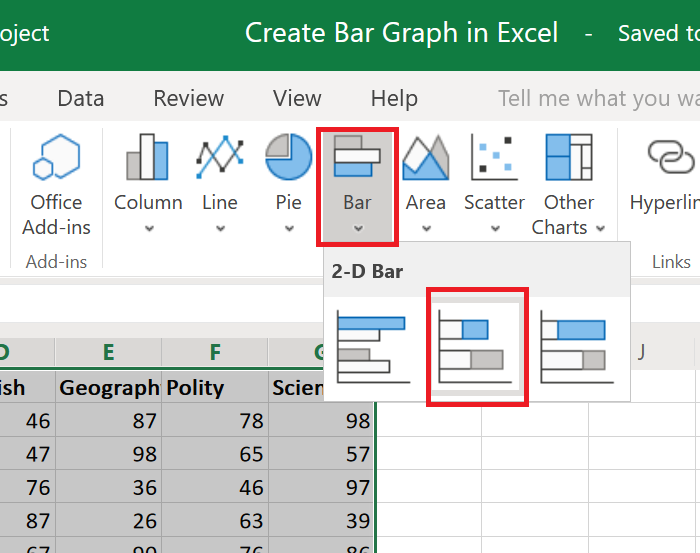
- Select the data in question, and go to the Insert tab.
- Now in the Charts section, click on the downward-pointing arrow next to the Bar Graph option.
- Select the type of bar graph you wish to use. The graph will immediately appear on the Excel sheet, but it might take a few seconds to load the data.
Usually, the chart’s location and size are centered. You can adjust both these parameters according to your needs.
For example, let us say we are provided with a set of data on students’ marks in a class. The data is further extended across various subjects. This makes the data complex because to compare students, you would have to literally pick each value from the list, highlight the row and column one by one, and check which student scored what in which subject.

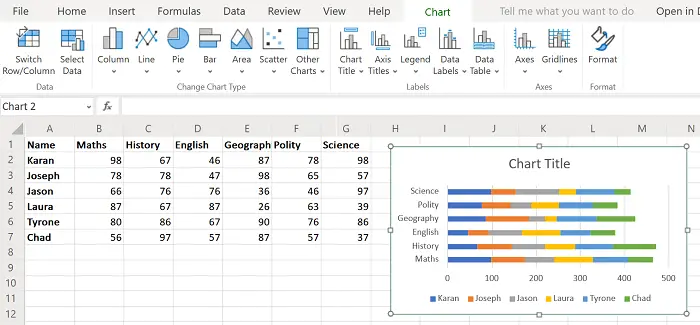
So, select the data from range A1 to G7 and go to Insert > Bar Graph.
Select the appropriate bar graph and change the location and size.

The subjects have been mentioned across Y-axis and the percentages across X-axis.

The names of the students have been mentioned using colors.
Now you can easily compare students on the basis of their marks scored in each subject.
How to make a Column Chart in Excel

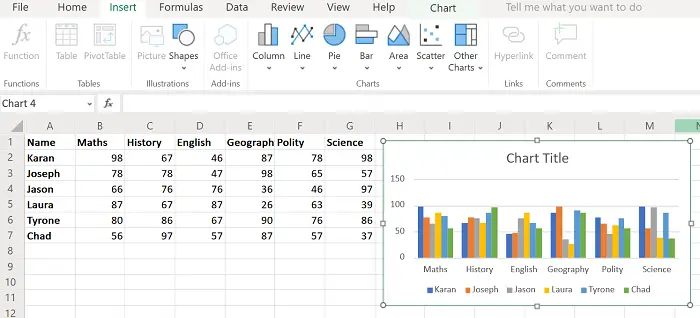
Alternatively, you could create a column chart. The procedure is similar to that for a bar graph as explained earlier, however, this time select Insert > Column and then choose the chart type.
A column chart makes details even clearer as you can simply compare the marks of 2 students by observing the respective heights of the columns. A column graph for the above-mentioned example has been shown in the image.
However, it should be noted that this graph is static. You can also choose to create a dynamic chart in Excel.
I hope it helps!
Leave a Reply