A flowchart is a kind of graphical visualization that depicts sequential steps for processes and workflows. It is mainly used to show how a process is done and to plan a project. There are different types of flowcharts including Process Flowchart, Process Map, Swimlane Flowchart, SDL Diagram, etc. Now, if you want to draw a flowchart in Microsoft Excel, here is a guide for you. In this tutorial, I am going to show you methods and steps to create a flowchart in Excel. Let’s get started!
How to create a Flowchart in Excel
You can draw a flowchart for processes in Microsoft Excel without using an external add-on. There are mainly two methods to do so. You can use one or a combination of both methods to create a flowchart. Here are the methods:
- Using SmartArt Graphics
- Using Shapes Tool
Let’s discuss these methods in detail now!
1] Make a Flowchart in Excel using SmartArt Graphics
Microsoft Excel provides you some SmartArt graphics to add different types of diagrams to your worksheet, such as hierarchy diagram, pyramid, relationship, matrix, cycle, etc. It also provides you some Process diagram templates that you can use to draw a flowchart in Excel. Just add a process SmartArt graphics and edit the steps for the process to create your own flowchart.
You can use this method by following below steps:
Launch Microsoft Excel and go to the Insert tab. From this tab, click on the Illustration section, and from the drop-down menu, select the SmartArt option.
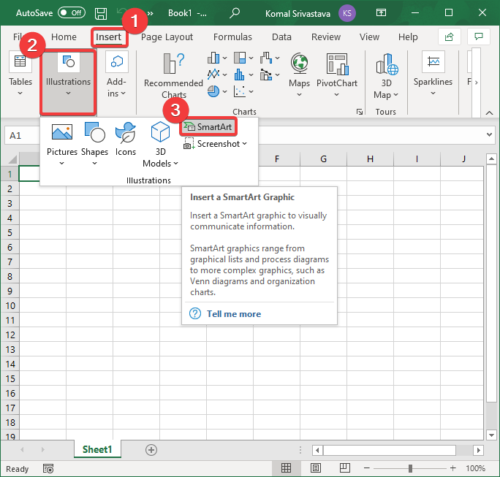
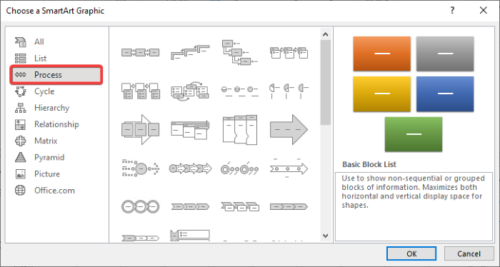
Now, go to the Process tab and you will various templates for adding a process diagram. Some examples of process diagram templates offered by Excel include Picture Accent Process, Alternating Flow, Step-down Process, Basic Chevron Process, Detailed Process, Vertical Equation, Vertical Bending Process, and more.
All the above process graphics templates are used to illustrate steps to perform a process, task, or workflow. You can use any of them depending upon your need. Simply select a process diagram template and click on the OK button. A sample process flowchart will be added to Excel.
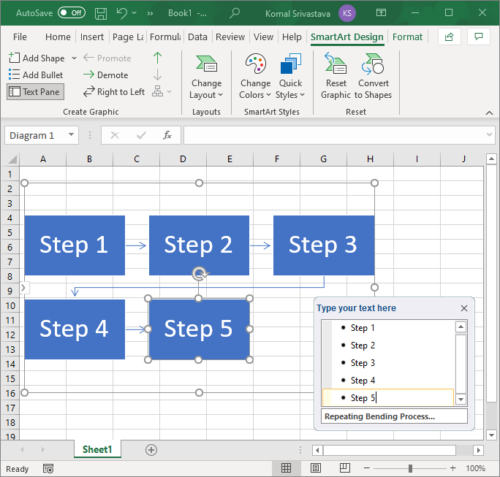
You can now edit the flowchart and add process steps to boxes to create a customized flowchart. If needed, you can delete any shape, change a shape, or add custom shapes by right-clicking on a shape. Plus, you can also format text, color, alignment, etc.
Try this method; it is easy and lets you quickly make a flowchart in Excel.
2] Create a Flowchart from scratch in Excel using the Shape tool
Another method is to draw a flowchart from scratch with the help of the Shape tool. Excel provides different shapes to create a totally new custom diagram. Follow the below steps to draw a flowchart using the shape tool:
Open Microsoft Excel, go to the Insert tab, and click on the Illustration > Shapes option.
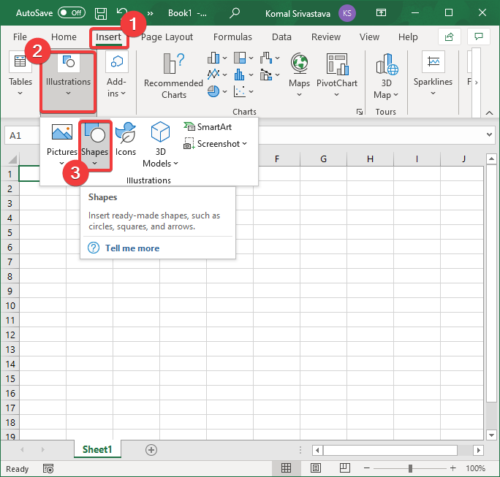
On clicking the Shapes option, you will see various shapes in different categories like lines, rectangles, block arrows, equation shapes, and more. Scroll down and you will see a Flowchart category. It contains different symbols that are used to create a flowchart, like process, predefined process, decision, internal storage, preparation, and a lot more.
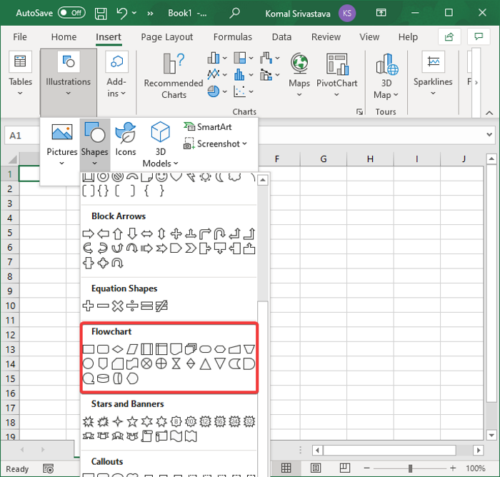
You can create a flowchart using all these shapes. Click on a flowchart shape and add it to the diagram. You can format the shapes and the entire diagram using various formatting options provided in Excel.
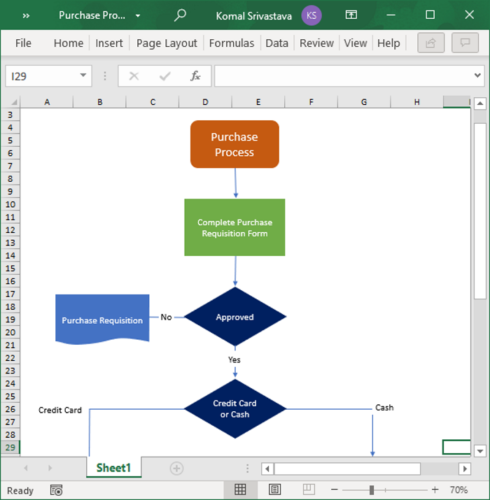
In this article, I discussed how to create a flowchart in Microsoft Excel without installing an add-on. You can use the flowchart shapes available in it or simply add a process diagram template from SmartArt graphics and edit it as you require.
Related Read: How to use Data Visualizer Add-In for Excel to create Flowcharts.