Charts make working with Excel sheets easier. However, it is important to know what kind of chart works better with what kind of data. If you are dealing with data involving comparative analysis of values spread across 2 different columns, try using the Line Chart or the Scatter Plot Graph. The procedure to create a line chart and scatter plot in Excel is discussed here.
Difference between Line Chart and Scatter Plot
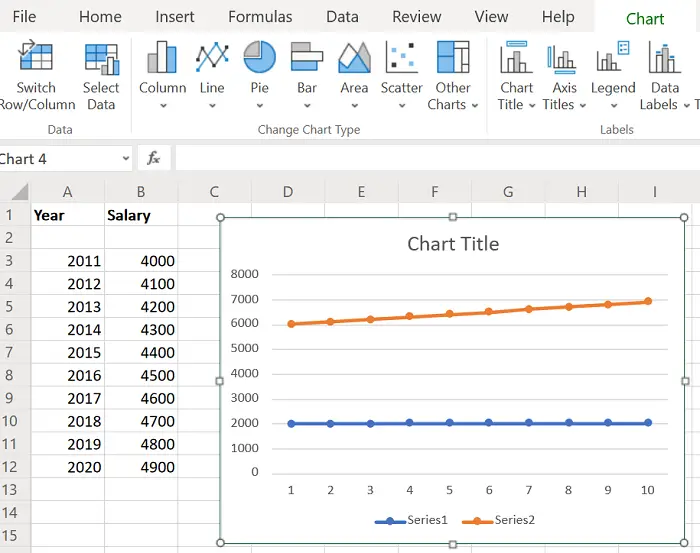
If you understand the definition of a mathematical function, a good way to judge it is that any line drawn parallel to the y-axis intersects with the values in the function’s curve only once. The same is the case with line charts. The values are plotted across the y-axis and the x-axis is used to mark the progression.
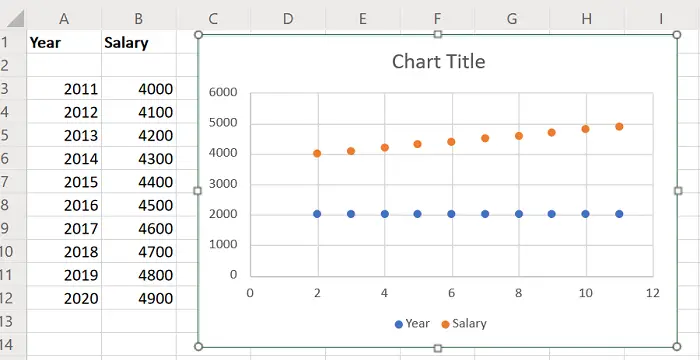
In the case of a scatter plot, whether you use it simply with marking points or lines, the graph is spread across the XY-axis.
Eg. Let us consider this example of a person’s salary across the years 2011 to 2020. The years are mentioned in column A, starting from A3 till A12. The person’s salaries for the respective years are mentioned in the corresponding cells across column B from B3 till B12.
How to create a Line Chart in Excel
To create a line chart in Excel, the procedure is as follows:
Select the data across both the columns (from A3 to B12).
Go to Insert > Line Chart.

Select the appropriate line chart.
Change the location and size of the chart as per your needs.
How to create a Scatter Plot in Excel
The procedure to create a scatter plot in Excel is as follows:
Select the data across both the columns (from A3 to B12).
Go to Insert > Scatter Plot.

Select the appropriate Scatter Plot chart.
Adjust the size and location of the chart as per your requirements.
You would notice that the line graph and scatter plot chart curves are different. However, these charts are static.
You could also consider creating Dynamic charts in Excel. By doing this, the curves in the graph would change as and when you change the value of the data.
Read: How to calculate Consumer Price Index or CPI in Excel and create its graph.
Leave a Reply