Blue Screen of Death (BSOD) also known as Stop Error is displayed on the Windows system after a system crash when your operating system reaches a threshold where it can no longer function safely. The stop error gets its name as the blue screen error because the alert message is displayed on a blue screen with the sad emoticon and a QR code which suggests a few possible fixes.
A BSOD usually occurs because of several reasons like corrupted Windows registries, bad drivers, misconfigured device drivers, corrupted files, outdated drivers, memory issues, and system hardware issues. Once you come across BSOD, your system will require you to reboot to continue to operate. However, before the reboot, it is recommended that the users make a note of the error message and error code.
The BSOD error is mostly displayed when your system is unable to recover the kernel-level error. The error message usually displays the driver data associated with the error and other information about the issue, and its possible fixes. Also when your system crashes with a BSOD error, the system creates minidump files, and all the memory data with the error details are dumped to a hard drive for future debugging. There are many ways in which you can read the minidump files for troubleshooting, including using the Windows Event Viewer. But the easiest way is using a free and handy utility called BlueScreenView that allows users to easily read the error report for troubleshooting.
BlueScreenView is a user-oriented utility that automatically scans all the minidump files which were created after the BSOD crash into a single table. For every crash occurrence, BlueScreenView gives details about the driver that was loaded during the crash, and other crash information in order to easily troubleshoot the problems and locate the suspected problematic drivers. Additionally, the free tool displays the blue screen error screen quite similar to the one that Windows displayed during the time of the system crash.
Using Blue Screen View is quite easy. All one has to do is run the executable files which will automatically scan all the minidump files that were created during the crash. It mostly displays the dump files created by a crash at the top pane and displays the associated drivers in the lower pane. In this article, we explain how to use BlueScreenView to read the crash report.
How to use BlueScreenView
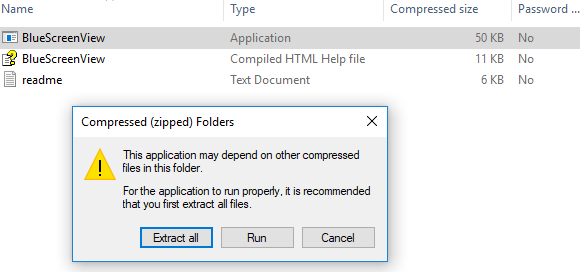
Once you have downloaded and installed it, run the BlueScreenView.exe executable file.
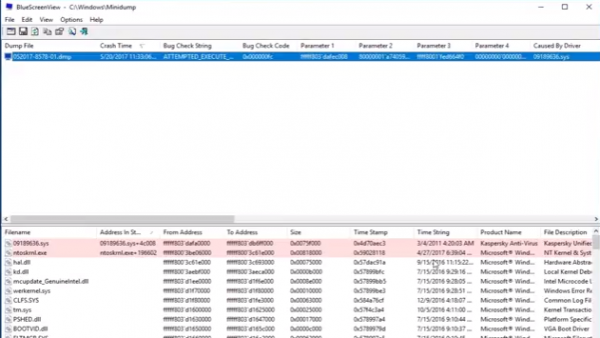
After running the executable file, the BlueScreenView automatically scans all your minidump folder to display the crash details. It displays the dump files created by a crash at the top window pane and displays the associated drivers in the lower window pane.
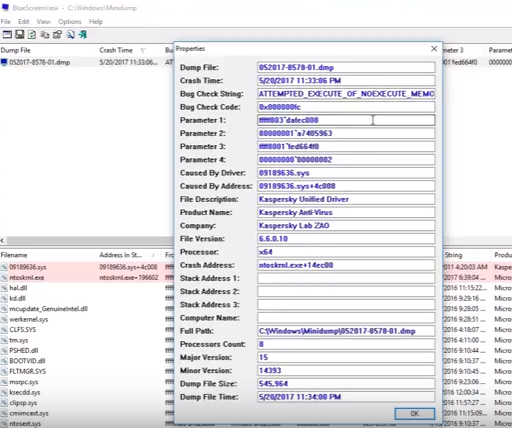
To know the properties of the error, double-click on the drivers which display the error details in a table format.
Users can also send an HTML report to the technician for troubleshooting. To do this, right-click on a dump file and select the HTML Report- All Items or HTML Report -selected Items from the drop-down menu.
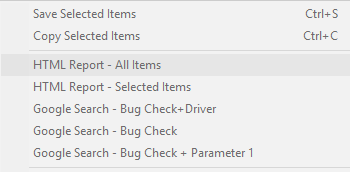
You can also save the reports for debugging the recurring issues. To do this, right-click on a dump file and select the option Save Selected Items.
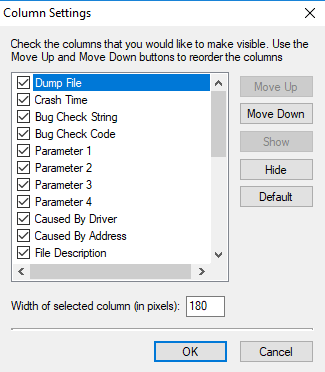
BlueScreenView allows its user to customize the columns which you would like to make visible and reorder the columns with Move up / Move Down button.
It is also available in other languages. To change the language of BlueScreenView, download the appropriate language zip file, extract the ‘bluescreenview_lng.ini’, and put it in the same folder where you installed the utility.
BlueScreenView is designed to run on the versions of Windows and can read the minidump files created by both 32-bit and x64 systems. The utility is available in different languages, and you can download it here.
I hope you find this post useful.
Also read: How to use Windbg to troubleshoot Blue Screen stop errors.
Leave a Reply