Are you new to YouTube and want to know your channel’s performance? YouTube has a feature called Channel Analytics. It shows the watch time and average views of your videos, as well as the performance of your videos and information on the audience that watches your videos.
How to use YouTube Analytics
In this tutorial, we will explain.
- How to open Channel Analytics.
- The Overview tab
- The Reach tab
- The Engagement tab
- The Audience tab
Channel Analytics is a YouTube feature that allows YouTubers to check the videos’ performance on their Channel Analytics.
On Channel Analytics, you will see different tabs that will display different information about your channel’s performance. These tabs are:
- Overview
- Reach
- Engagement
- Audience
1] How to open Channel Analytics
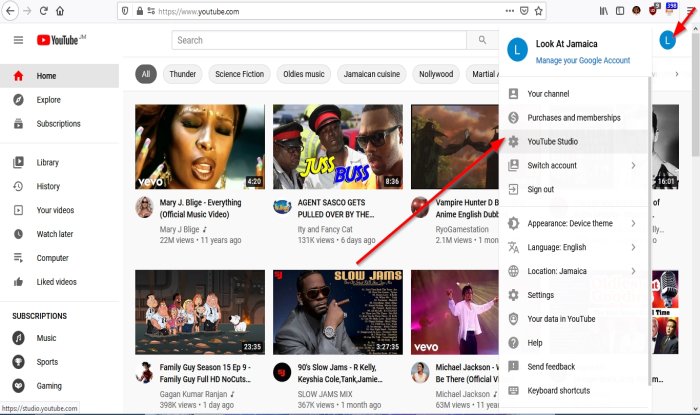
Open YouTube.
On Your YouTube page, click your channel logo.
In the drop-down menu, click YouTube Studio.
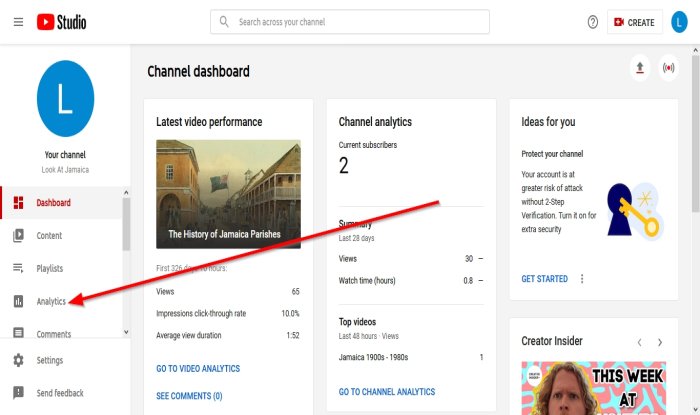
It will automatically load on the Dashboard page.
On the left pane, click Channel Analytics.
2] The Overview tab
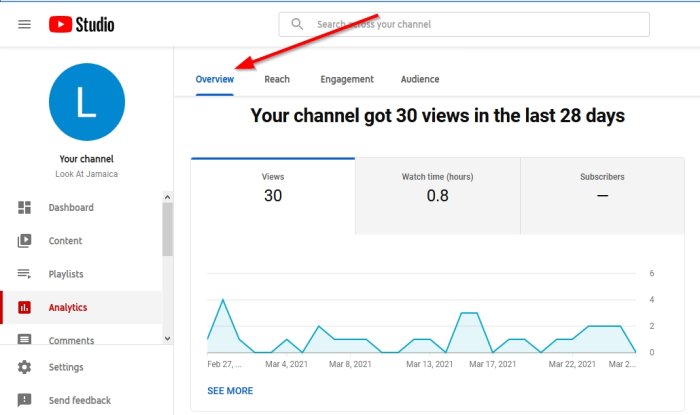
The Overview tab shows the metric for your channel. The main graph will show the number of Views your videos received total, the overall Watch time (hours), and the increasing or decreasing Subscribers on your channel. If you want to see more info, click See More. 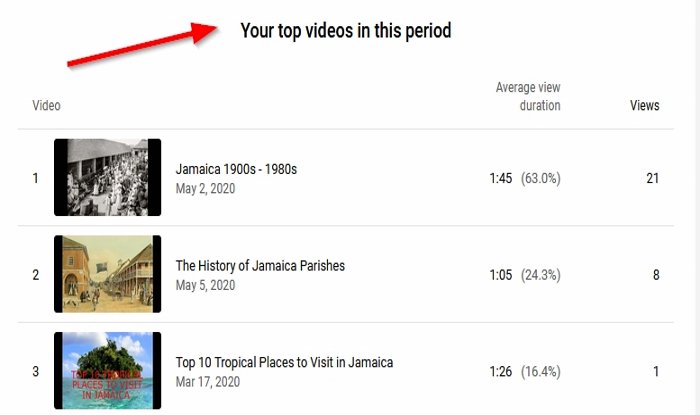
If users scroll the page down to the Your Top videos in this period section, which are videos ranked in views, they will see info about the number of Views the video got and the Average view duration.
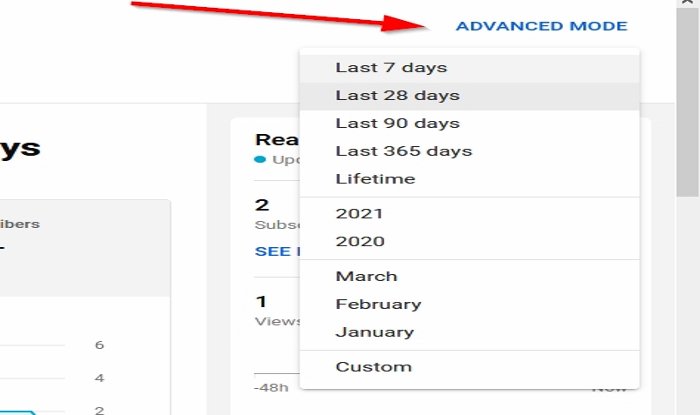
On the right, you will see Advanced Mode. The Advanced Mode allows you to check the video analytics according to the Month, Days, and Years.
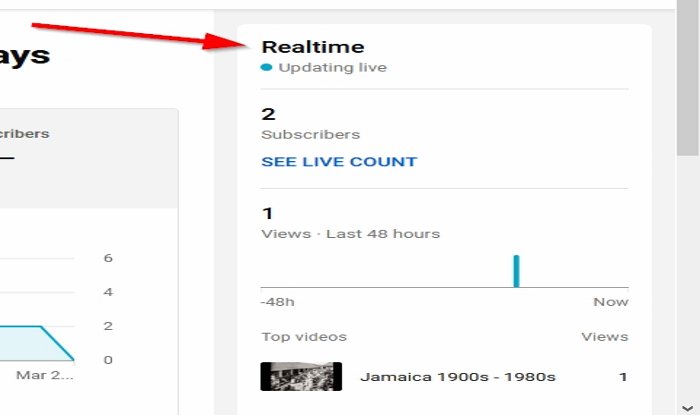
You will see more details about your channel on the right pane of the Overview page, such as Realtime, the number of Subscribers your channel got, the last Views your channel received, and the Top Videos of your channel.
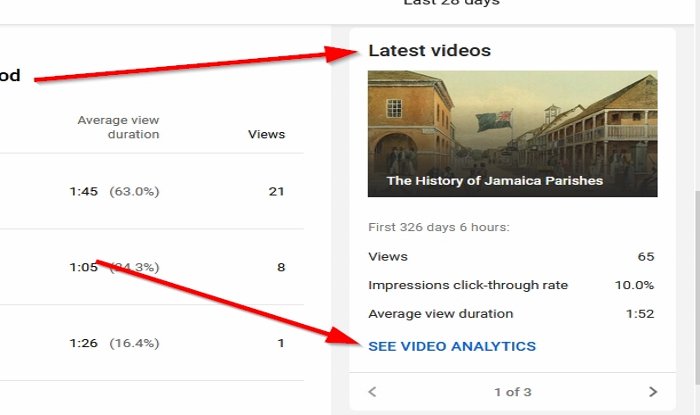
Below the pane, you will see the Video Analytics for your latest video. The Video Analytics will display the number of views your video got, the impression click-through rate, and the video’s average view duration. If you want to see more information about your Video Analytics, click See Video Analytics.
Subscribe: TheWindowsClub Channel.
3] The Reach tab
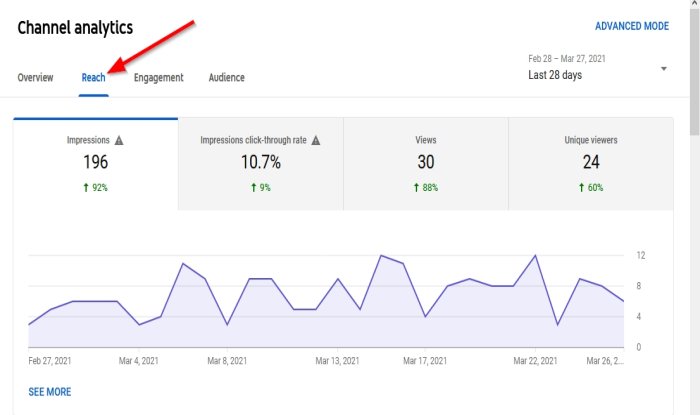
The Reach tab displays your video’s overall reach; it shows a metric graph showcasing the Impression, the impressions click-through rate, Views, and the Unique views.
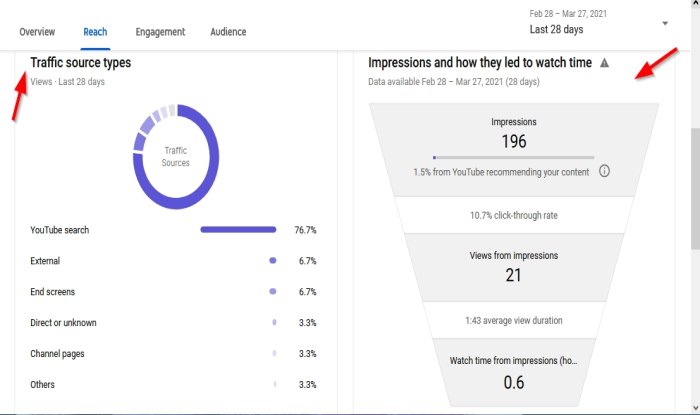
It will show info on the Traffic source type, which is where persons found the videos, Impressions on how they are led to watch time which is how many people saw the video on YouTube, Traffic source external which is traffic from website and app that your YouTube video is linked to, Traffic source playlist, Traffic source suggested video and Traffic source YouTube search.
4] The Engagement tab
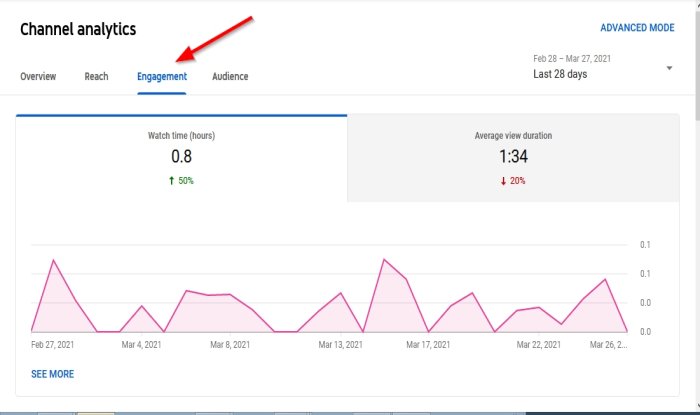
The Engagement tab showcase what your viewers are watching. The main graph displays the total Watch hours and Average view duration.
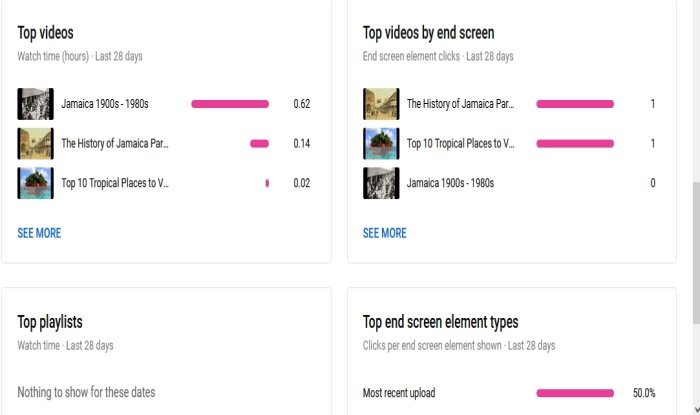
The Engagement page also shows the Top videos, Top videos by end screen, Top playlists, Top screen elements types, and Top cards.
5. The Audience tab
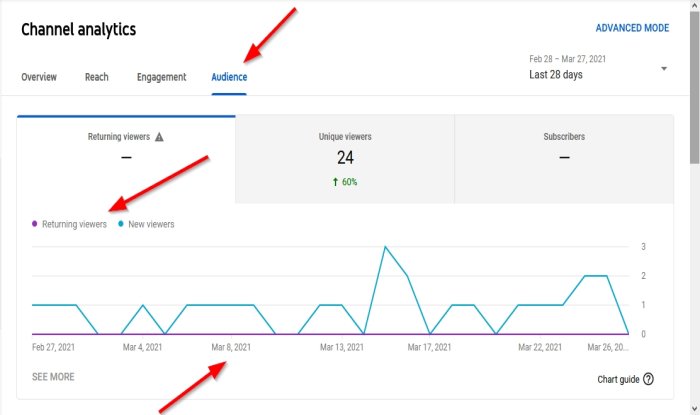
The Audience tab shows who is watching your videos. The Audience tab’s main graph displays Returning viewers and New Viewers, the Date they watch the videos, and Unique viewers, and the number of Subscribers your channel received.
The Audience tab also shows When your audiences are on YouTube, the Watch time from subscribers, Other channels your audience watches, Other videos our audience watches, Age and Gender, Top Geographies; which shows the audience by Geography, and Top subtitles/CC language.
I hope this helps.
Now read: How to Add Social Media links to YouTube and share Video Clips.
Leave a Reply