Microsoft Excel is quite the powerhouse when it comes down to creating spreadsheets, among other things. There is simply nothing else like it in terms of features offered, which is why Excel is the best tool in its category.
How to view Excel workbook statistics
One of the best features of Excel is the ability to view your Workbook statistics. You can have a look at data relating to the number of cells located in a document. But not only that, users can view information on charts, tables, and much more.
This feature is quite similar to what you’ll find in Microsoft Word, so if you’re the type of person who enjoys looking at words and numbers with deeper meanings, this is definitely for you.
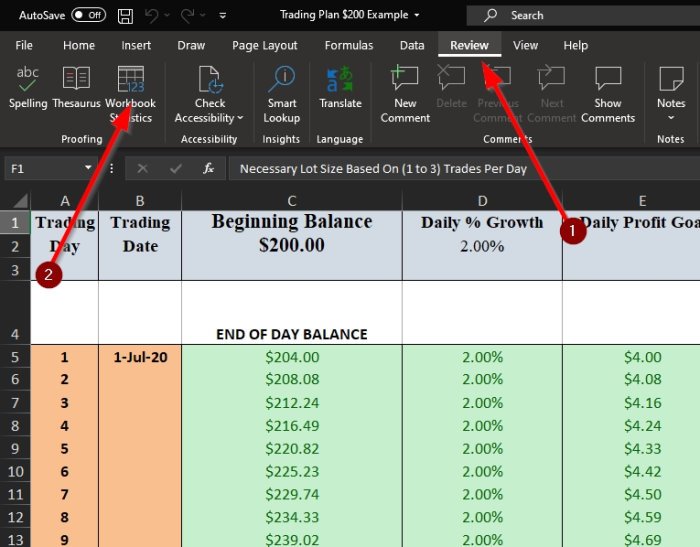
Click the Review tab in the Ribbon

To begin the process of looking at statistics relating to your Excel document, you must first click on the Review tab. You should see a ton of options to choose from, which might be a bit confusing for amateur users of the popular spreadsheet platform.
View your Workbook Statistics

After clicking on Review, you should now select the Workbook Statistics button via the top-left corner of the document. Once that is done, you should see a small pop-up window showcasing the statistics of the opened Excel document.
Here is the information located in the statistics
If you’re curious about all the possible data the Workbook Statistics will display, then look below and be amazed:
Worksheet level
- End of sheet / Last cell
- Count of Cells with Data
- Count of Tables
- Count of PivotTables
- Count of Formulas
- Count of Charts
- Count of Images
- Count of Form Controls
- Count of Objects
- Count of Comments
- Count of Notes
Workbook level
- Count of Sheets
- Count of Cells with Data
- Count of Tables
- Count of PivotTables
- Count of Formulas
- Count of Charts
- Count of External Connections
- Count of Macros
If you want more information, please leave a word in the comment section.
Read next: How to remove #DIV/0! error in Microsoft Excel.