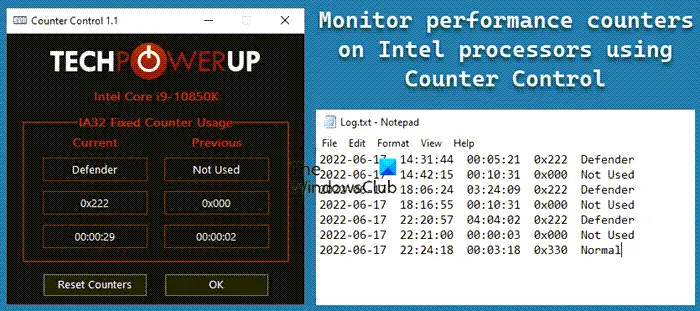
The complexity in the performance of computers has increased tremendously over the years. There are many aspects like multithreading, non-uniform memory, etc. that have a huge impact on modern processors. In this guide, we explain to you a tool or program, Counter Control that can help you understand and monitor Performance Counters on Intel Processors.

What are Performance Counters?
Performance Counters provide system-level data and logs of various kinds of system performance like processor, memory, and disk usage statistics. There are different tools to monitor the performance counters on our processors which give us an interface to see the values and know, how the performance of the processor is impacted by the various tasks that are running.
Counter Control helps you monitor performance counters on Intel processors
Before going into Counter Control, you need to know that there are three fixed-function counters on Intel processors:
- Mode 0 – Disable
- Mode 1 – OS (Ring 0)
- Mode 2 – User (Ring > 0)
- Mode 3 – All Ring Levels
Counter Control software can help you monitor performance counters and logs the “IA32_FIXED_CTR_CTRL” register of Intel Core processors, located at MSR 0x38D. The particular register gives access to the three kinds of performance counters. With Counter Control, a user can know which software is using the Intel fixed-function counters, and how long they are used.
Counter Control reports the Performance Counters in the following values.
- Not used – 0x000
- Defender – 0x222
- Normal – 0x330
- Warning – 0x332
Let’s get into the details of each one.
1] Not used – 0x000
It indicates that none of the three fixed-function counters are in use. They are stopped without any usage.
2] Defender – 0x222
This means that the three fixed-function counters are programmed to mode 2. Windows Defender sets the values to the counters when using them.
3] Normal – 0x330
In this, two fixed-function counters are set to mode 3, and one is set to mode 0 and not being used. Monitoring programs that use these counters will set the counter control register to this value.
4] Warning – 0x332:
This indicates that the two fixed-function counters are being used by the monitoring software and the third one is set to mode 2, most likely by Windows Defender. It is a warning because two different programs are fighting for control over the shared counters between them. During this, the Counter Control values constantly fluctuate with 0x222 and 0x332. You will see this happen when you run HWiNFO (System information, monitoring, and diagnostics tool) and the Windows Defender is trying to use the IA32_FIXED function counters at the same time.
These are the different Performance counter values reported by Counter Control. You can download it from techpowerup.com.
How to fix the Windows Defender Bug in Performance Counters
The performance of your machine is affected by the Windows Defender bug where the performance will be significantly reduced as the Windows Defender and other programs that use the Fixed-function counters are fighting for complete control of them. Windows Defender randomly uses all seven hardware performance counters on the Intel Core Processors, that include the three fixed performance counters. Other programs might also use them and overclock the CPU since these are shared counters.
All the system utilities like HWiNFO, OCCT, Core Temp, and ThrottleStop set the counters to mode 3. Since they are all set to the same mode, there will be no problem with the performance. Windows Defender on the other hand set these to mode 2 randomly and at random intervals. This creates conflict and hinders performance.
You can fix the Windows Defender Bug with ThrottleStop. It has a new feature in the Options window called Windows Defender Boost. Checking this box will help ensure maximum performance and accurate Core Effective Clock monitoring whether Windows Defender Real-time Protection is enabled or not.
Read: ThrottleStop: Monitor & disable CPU throttling on Windows laptops.
Leave a Reply