Microsoft Edge provides its users with Network tools that can be used by developers and even a computer networking student to make sure that the resources required for the proper functioning of the webpage are downloaded and that the communication with the server-side APIs is not disturbed. In this post, we will go over the Network tools of Microsoft Edge so that you can have a better understanding of your webpage.
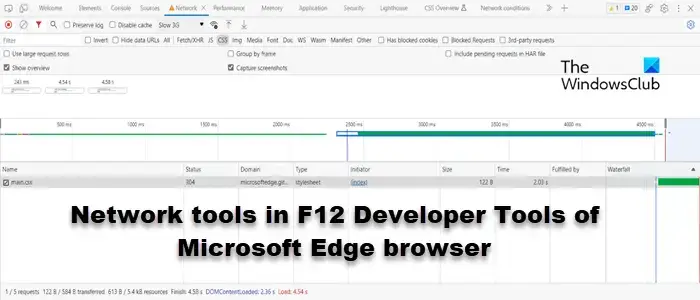
What does F12 do in Edge?
The F12 button in Microsoft Edge brings up the Developer Tool. With the help of this tool, one can understand the website, access the code that went into building it, and then make the required changes. It also has a Network tool that helps the developer to understand and stimulate how will the behavior of the website vary depending on the Internet.
Network Tools in F12 Developer Tools in Edge
Network tools are built for developers to optimize web pages. There are various inbuilt tools that one can use in order to have an eye over the way their tool web page responds to the Internet. It makes sure that resources are downloaded at all times. Not just that, it checks the request parameters and the responses received from the API of the server.
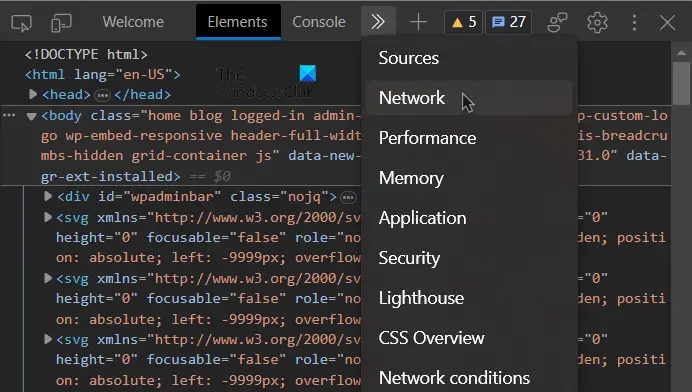
The following are two ways to open DevTools.
- Go to the webpage and click F12. If this is your first time, you will be asked to click on the Open DevTools button.
- Right-click on the webpage and click on Inspect.
Once you have opened DevTools, click on the Network tab to access the network tools. In case there is no Network tab, click on the Arrow (>>) button and then select Network.
Before understanding the tools that are available to the user, we first need a little overview of the user interface of the Network tool. The UI is divided into three parts, let us talk about each one of them.
- The topmost section of the Network tool has a toolbar that is used to make changes to the tool and add network filters.
- Below the top toolbar, we have an Overview graph. From here we can check the traffic and filter network requests.
- Finally, we have a Network log section. It contains records of individual network activity and allows you to inspect them.
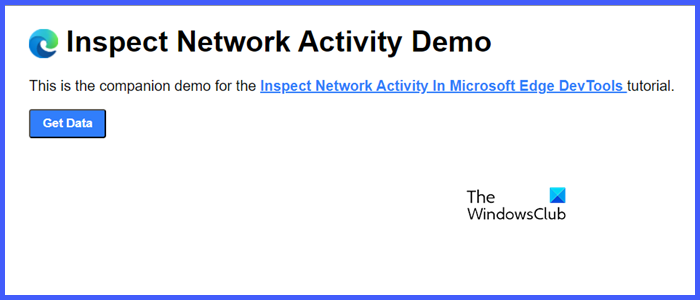
We will use the Demo webpage to understand the Network Tools and their behavior. To access it, go to microsoftedge.github.io.
There are various things you can do with the Network Tools in the F12 Developer Tool of Microsoft Edge. We have listed them below, so check out the ones that you find useful.
- Log Network Activity
- Check for more information
- Verify for slower connection
- Capture Screenshots
- Inspect source details
- Search for network headers and responses
- Filter resources
- Block requests
Let us talk about them in detail.
1] Log Network Activity
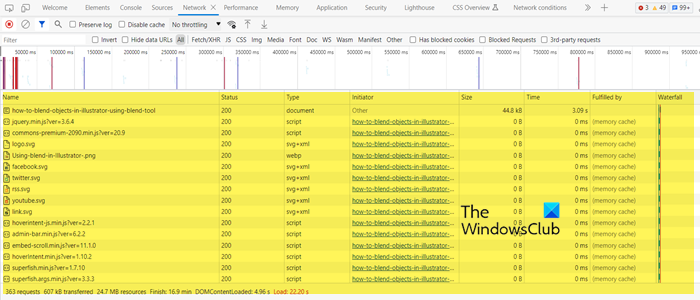
First of all, we have Log Network Activity monitor. As the name suggests, this tool keeps track of all the network activity that a page causes or undergoes. There are various rows in the Network Log. All of them represent a resource and will be listed in chronological order by default. Here, the resource present at the top of the list is an HTML document, more often than not. And, whatever our last request was, will be recorded at the bottom of the list.
Following are the columns of the Network Log.
- Name: Shows the name of the request along with its extension.
- Status: Shows the HTTP status code for the requested response.
- Type: Displays the resource type.
- Initiator: Shows why the request is received.
- Time: Shows the duration of the request.
- Waterfall: Graphically represents all the stages of the request.
Every single column gets written whenever a request is made.
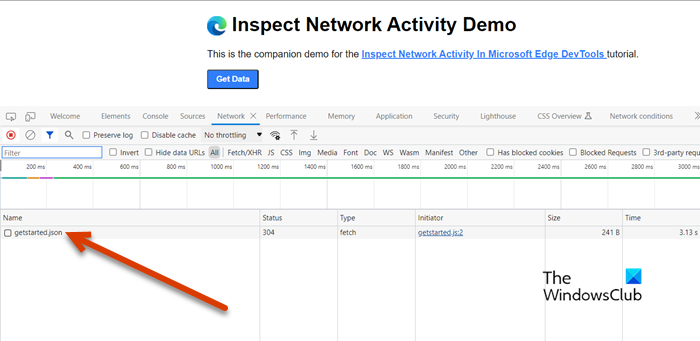
Now, to understand what is being recorded. Go to the demo webpage mentioned earlier and click on the Get Data button. You can then check the Network Log as there will be an entry of a JSON file at the bottom of the list or if you are using the webpage for the first time, this will be the only entry.
2] Check for more information
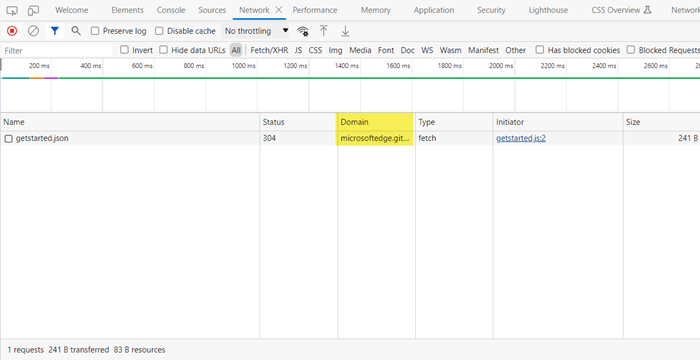
The columns in the Network tool are configured to hide most of the information. This is done to stop the screen from getting cluttered. You can check more information by just right-clicking on any column and selecting Domain. This will add the Domain column showing the domain of the response. To check the entire URL, hover over the name of a particular entry and you will be able to check its URL.
3] Verify for slower connection
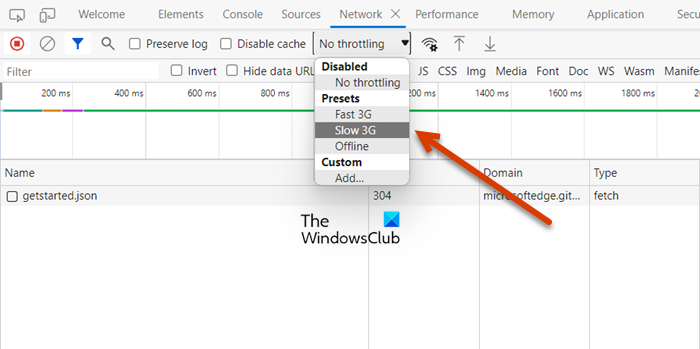
It is very likely that the user who will use your website might not have as fast an Internet connection as you have. That is why, optimizing the webpage for the slowest connection possible should be our utmost responsibility. To check how optimized our website is on this parameter, we should stimulate for a slower connection. Follow the demo given below to understand how to do the same.
- Go to the throttling drop-down menu; initially, it will be marked as “No throttling”.
- Select Slow 3G.
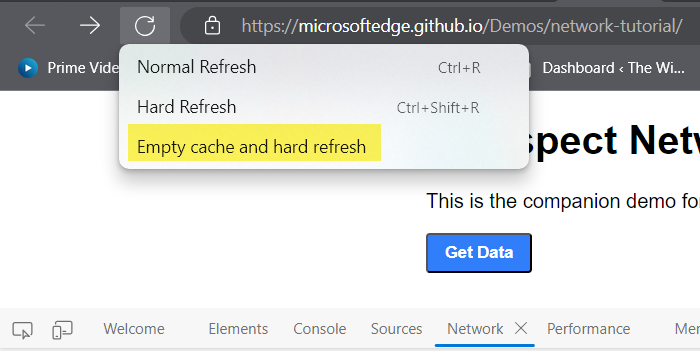
- Now, long-press on the refresh button on the webpage, and it will be marked as
 .
. - Finally, select Empty cache and hard refresh.
After refreshing the webpage, check the Time column. You can see a substantial difference in the time it takes for the website to process the request.
4] Capture screenshots
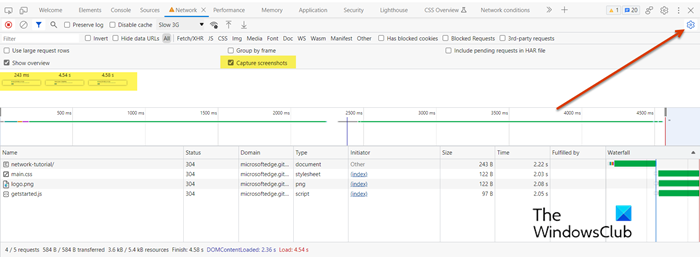
Taking screenshots records the webpage and the request at a certain point. You can access the screenshots just by clicking on the cog button present in the second line of the Network tool window and then check the box associated with Capture screenshots. You will see three thumbnails. Click on them to view their activities.
5] Inspect source details
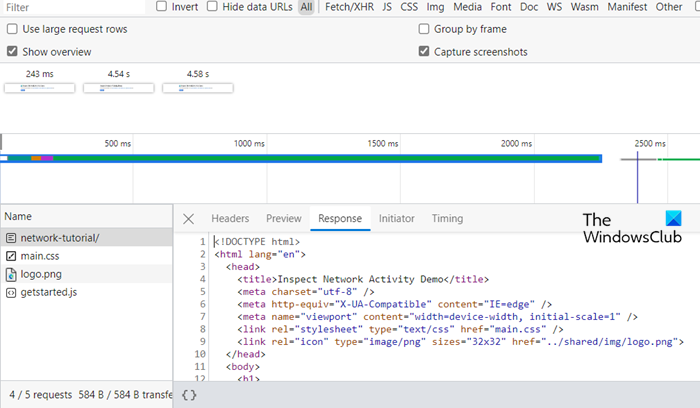
We can also check the details of the source to learn more about it. It is pretty simple to do the same. Click on network-tutorial from the Network Log’s Name column. This will open a new window with multiple tabs. You can click on Preview to know how your page will look, go to Response to know how HTML code, and then to Timining to know the network activity.
6] Search for network headers and responses
You get the Search bar in the Network Tool that can be used to search for network headers and responses. To access it, click on the Search button, which is a magnifying glass. This will open the left panel. You can search for whatever it is that you need in the code.
7] Filter Resources
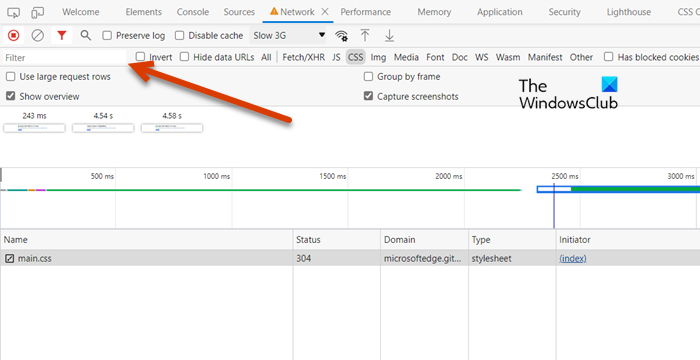
If you want to declutter your work window, try the Filter option of the Network tool. The Filter button looks like ![]() or there will be a Filter search bar. You can click on the same button from the toolbar to trigger to start filtering.
or there will be a Filter search bar. You can click on the same button from the toolbar to trigger to start filtering.
You can filter by string, regular expression or property. So, for example, if you want just want to check out PNG images, just right “png” in the Filter bar.
One can also filter by resource type. For example, if you click on the CSS button, every other resource type will be filtered out.
8] Block Request
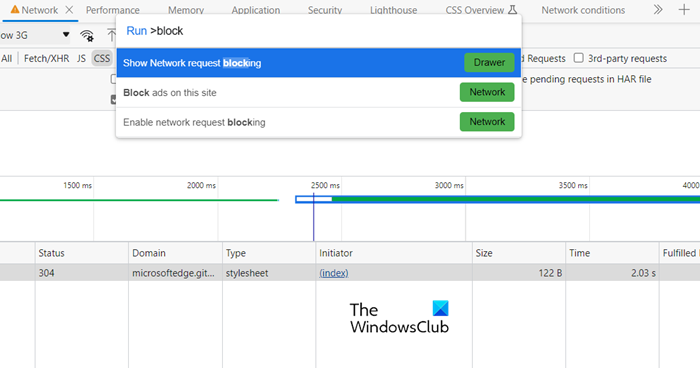
At times, some page resources will not be available due to some technical glitches. We need to ensure that our page still looks presentable and performs the required task. To do the same, we need to follow the steps given below.
- Hit Ctrl + Shift + P (for Windows and Linux) and Command + Shift + P (for macOS).
- Now, type block and select Show Request Blocking.
- Then tick the box next to Enable network request blocking and click on the (+) button.
You can block the request you want from here.
These are the various things one can do with the Network tools.
Related: List of Dev Tools in Microsoft Edge browser
Where is Network in Developer tools?
It is pretty easy to access the Network tools in the Developer tool. All you have to do is first open the Developer tools and then click on the Arrow (>>) button. There are various tabs. Click on Network, as it will bring up Network tools.
TIP: See how you can change User-Agent, Mode, Display, and Geolocation in Edge Developer Tools.
Are Edge dev tools the same as Chrome?
Yes, they are the same. Both the browsers use the same Chromium browser engine, and hence they offer the same set of features in the developer tools. However, you can use the Microsoft Edge DevTools extension for Visual Studio Code, which lets you use the browser elements and network tools within the VS code.
How do I use EDGE dev tools?
Open the Microsoft Edge web browser to access the developer tools. Click F12 on your keyboard. Click the More tools icon and then click More tools > Developer Tools if you press Ctrl+Shift+I or click the Setting and more ellipsis icon as an option.
Leave a Reply