Planning to get your business up and running? What if you could predict where your production business would end up in a few years from now, wouldn’t that be swell? This is not easy unless you have a fortune teller or just some guy who is capable of traveling to the future and back. The Flash, maybe?
Thanks to a software known as Startup Product Manager earlier called Predicted Desire, you won’t have to rely on a fortune teller or some comic book character, because it can all be done with this simple program. Bear in mind, this is just a software designed by human developers, don’t go in expecting magical things to happen out of thin air.
NOTE: Predicted Desire is now called Startup Product Manager (StPM).

Startup Product Manager for Windows
Startup Product Manager is a free Windows software forecasts & tells you how much money you need to start and run a business. It is a startup product calculator.
From what we can tell, the software is capable of calculating different things that have to do with a business. For example, cost, net profit, and efficiency, are just some of the things this program can deal with. Right away you can see the combined effects for up to 48 months, so from there, business owners can plan out their future.
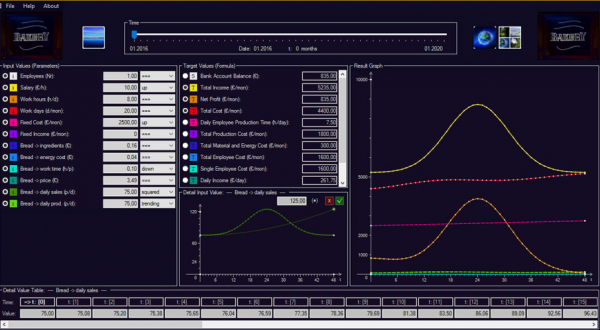
After launching Startup Product Manager for the first time, the program shows us a calculator and a window that required us to choose our specified simulation. After that, the software will eventually display the main window to get things up and running to what users want to see.
The following are some input parameters that we could specify:
- Number of employees
- Salary per hour
- Work hours per day
- Work days per month
- Fixed cost per month
- Fixed income per month
- Energy cost
- Price
- Daily sales
- Daily production
When it comes down to target values, the following is what the program allowed us to choose from:
- Bank account balance
- Total income per month
- Net profit per month
- Total cost per month
- Total production cost per month
- Total material and energy cost per month
- Daily employee production time
- Total employee cost per month
- Single employee cost per month
- Daily income
- Daily production cost
- Single unit/product production
At the top of the main user interface, there’s a slider that allows us to choose our desired period. It can be anywhere between January 2016 and January 2020. At the lower section, it displays the date and a total number of months.
Startup Product Manager will draw up graphs in real-time, and it all depends on the choices made. There’s also something called the Result Graph, and this displays the development of all specified input and target values covering the selected time-frame.
Bear in mind that some curves have similar colors, so if you want to focus on a single one, chances are, you might have to disable a few and only leave the main curve in focus.
Verdict
Startup Product Manager is a great financial tool, just don’t go in expecting it to be easy to understand. It’s difficult at times, but once you get it and know what you want the program to do for you, then it should be smooth sailing after a time.
Download Startup Product Manager from the official website.