As a Windows user, at some point in time, you do feel concerned about the speed of your machine. It could be about how quickly your system responds while logging in or how fast it runs to accomplish usual tasks. To find exactly what the programs running on your PC are doing you need to install a monitoring tool and this is where Sysinternals Process Monitor tool comes into use.
Use Process Monitor to measure reboot & logon times
Although there are several monitoring tools for Windows, Process Monitor offers advanced diagnostics and tackles various troubleshooting scenarios. It has been developed to monitor the system right from its starting phase and provides useful information such as:
- Time required by the system to display logon screen
- Time required by the user to enter the credentials
- Time required by the system to start the Explorer
- Time required by the system to set up the desktop in a ready state (Desktop is in a ready state indicates that Windows has started with the majority of its services and processes and the user can start interacting with various applications without waiting for a busy cursor sign)
The features of Process Monitor are as follows:
- Display as well as record real-time file system, Registry, and process/thread activity
- It can record booting time by running in real-time mode
- Using Process Monitor, you can filter, search and create reports about system and registry activities
- Troubleshooting tool for the System admins
- Malware hunting
How to use Process Monitor
- Process Monitor does not require installation. You have to download a zip archive. Once you extract the files, you can run Procmon.exe to launch the application.
- When the tool is run for the first time, the user will be asked to accept the End User License Agreement (EULA). Once accepted it would never be displayed again for the same profile.
- Simply pin the tool to the taskbar with right click option. It would be easy to start the Process monitor with just one click.
Process Monitor User Interface
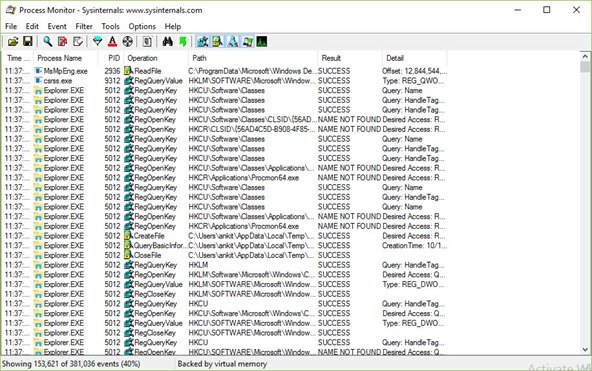
As soon as the UI window opens, the tool starts capturing information about Registry, Files and Process/Thread activity. The UI reminds you of a spreadsheet with a massive outlay of information. There are filters that users can apply to sort the collected data.
You will see the growing list of processes in the main window with information categorized under several useful headers.
How to record a Reboot Cycle trace with Process Monitor
Follow the below-mentioned steps to trace the reboot cycle of your system:
Locate the file named “ProcMon” from the unzipped folder and click.
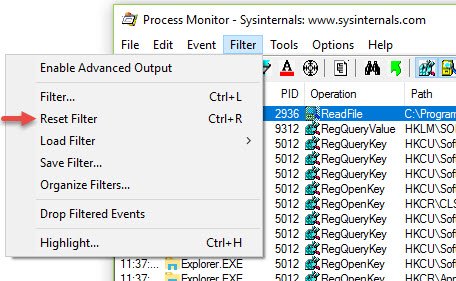
Once you see the Process Monitor Filter’ interface click on the ‘Reset’ button to reset filters to default values, and then click the ‘OK’ button.
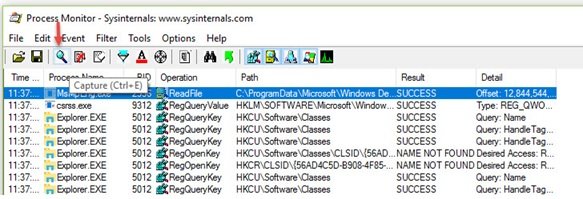
Now, click on the Capture button in the file menu to stop the current real-time trace as shown:
Note: It is advisable to filter some events from the trace that are not required in analyzing reboot and logon and reduce the trace to very small size. Mentioned below is the process to filter out unwanted events.
On the ProcMon icon bar de-select the following categories of events:
- Show Network Events
- Show File System Activity
- Show Registry Activity

Now, click on the “Filter” option from the ProcMon menu and then click on the menu “Drop Filtered Events”.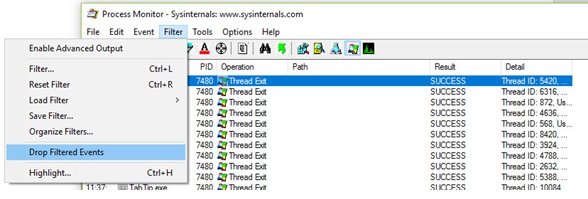
In order to start tracing click “Options” on the Process Monitor menu. Then click on “Enable Boot Logging” to enable the Process Monitor boot logging till the tracing is stopped.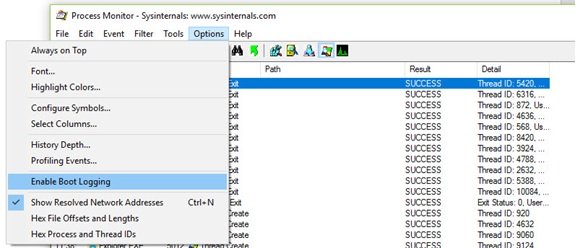
A dialog box stating “Enable Boot Logging “ will appear with the option to “Generate Thread Profiling Events”. Click only on OK button and avoid clicking other options to enable boot logging on the subsequent reboot as shown below.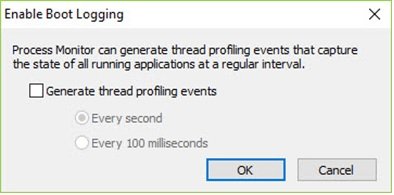
Now close the Process monitor and restart the computer.
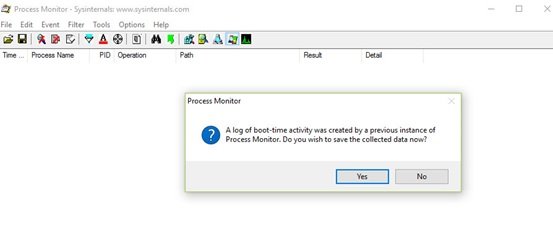
If you wish to save the disk space, then log on once your system initiates, Now, start the Process Monitor and stop it. Save the trace. This will ensure that an excessive amount of disk space is not consumed.
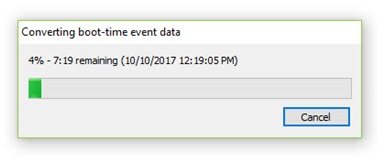
So, this was about how we can record the trace using Process Monitor. Now, let us see how to analyze this trace.
Read: Freeware to measure Boot or Startup Time in Windows.
How to analyze the reboot cycle trace with Process Monitor
- Once the system starts, logon and start the Sysinternals’ Process Monitor.
- Now reset the filter as mentioned above and click Ok.
- A dialog box will ask you to save the current trace. Save the trace in a folder.
- Now, this boot trace will be available and even displayed in Process Monitor.
- Next, click on “Tools” and then on “Process Tree”.
- Here, click on “Idle” the first item in the leftmost column and keep the note of the time on the clock.
- Again click on “Tools” and then on “Process Tree”. Look for the option “Logonui.exe” in the leftmost and click on it while noting the clock time as shown below.

The difference between both the noted time that is between Idle time and Logonui.exe time is the time gap between computer startup and logon credentials.
Above was an explanation of how to reboot cycle time is evaluated with Process Monitor. Now, let’s understand the significance of Userinit.exe.
‘Userinit.exe is the process that is launched if the user’s credentials are verified, and initiates the subsequent chain of events leading to the user’s shell starting, desktop starting, and the important marker “desktop ready to use”. The ‘Userinit.exe’ process should be relatively close but under’ the previously noted process ‘Logonui.exe. Note the clock time for starting of the ‘Userinit.exe’ process. The difference in clock time between starting of ‘Userinit.exe’ and ‘Procmon.exe’ is roughly that particular user’s overall logon time.
It is quite easy to measure respective times using the Process monitor.
Process Monitor uses just 8KB or 8192 bytes to monitor the reboot time. Also, its powerful filtering capability requires just “”process start” events to be collected. Thus overall logon and reboot trace statistics are not affected by the trace capture.
This is one of the special features of Process Monitor that makes it outstanding from all other tools designed for the same purpose.
Other features
- Process Monitor allows you to capture data according to your parameters. This feature is not available with other tools.
- Previously collected data remains with you even after new queries.
- By capturing and analyzing thread stacks for each operation, you can detect the root cause
- Process details include image path, command line, user and session ID
- Columns are configurable – They can be moved, hidden or shown
- Extensive filters for any data field
- Process tree shows the relationship of all processes in a trace.
- Possibility to cancel search
- Boot time logging for all operations
- Advanced logging architecture scales to tens of millions of captured events and gigabytes of log data
- Ability to save native log format data for use in different Process Monitor instances
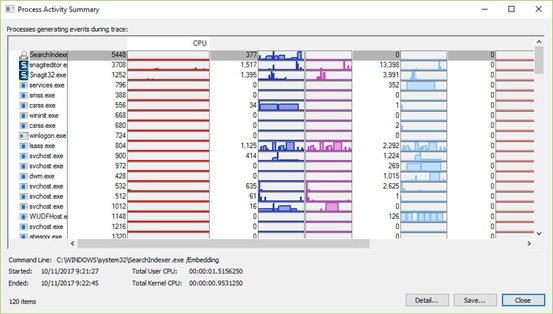
Click on Tools to choose from the other set of useful tabs like System details, Process Activity Summary, File Summary, Registry Summary and more.
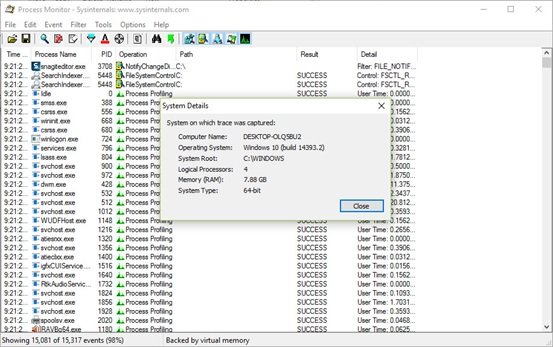
Refer to the screenshots for reference.
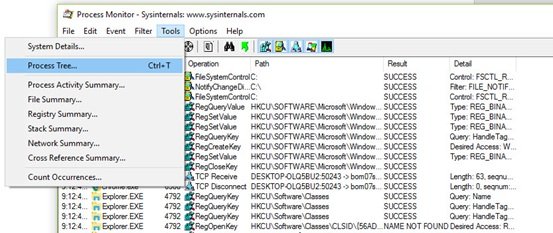
You can also see the Process activity summary.
The only drawback of Process Monitor is that it is a bit complicated for the novice user to use. Most users may find it challenging to use the tool and may have to invest time in understanding how it works.
IT experts, Systems admins, or technology geeks are best suited to utilize the features of Process Manager.
To download Process Monitor visit docs.microsoft.com. For more details visit TechNet.