When a running Windows application stops or crashes unexpectedly, your system generates a ‘crash dump file’ to save information present just before the crashing event occurred. Reading these crash dump files may help you find and troubleshoot the cause of the error. Find how you can read a Mini/Small Memory Crash Dump (DMP) file created by Windows.
How to open an read Small Memory Dump (DMP) files
A small memory dump file records the smallest set of useful information that may help you pinpoint why an application crashed or stopped unexpectedly. The newer version of Windows automatically creates a new file every time your computer stops unexpectedly. The history related to these files is stored in the %SystemRoot%\Minidumpfolder. The dump file type contains the following information:
- The Stop message and its parameters and other data
- A list of loaded drivers
- The processor context (PRCB) for the processor that stopped
- The process information and kernel context (EPROCESS) for the process that stopped
- The process information and kernel context (ETHREAD) for the thread that stopped
- The Kernel-mode call stack for the thread that stopped.
Users can use the Windows Debugger (WinDbg.exe) tool to read small memory dump files. It (WinDbg) comes as a part of the latest version of the Debugging Tools for Windows package.
You can install the debugging tools as a standalone component from the Windows Software Development Kit (SDK).
During the setup, when the SDK installation wizard appears, check the box marked against Debugging Tools for Windows. This action will enable you to install the debugging tools as a standalone component from the Windows Software Development Kit (SDK).
Once you have set up the Windows Debugger, open a dump by choosing Open Crash Dump option from the File menu or by pressing CTRL+D.
When the Open Crash Dump dialog box pops up on your computer screen, enter the full path and name of the crash dump file in the File name box, or use the dialog box to select the proper path and file name.
Now, when the proper file has been chosen, select Open.
Wait for a few seconds to allow the dump file to load as it connects to the Internet and downloads the required symbols to display in the readout.
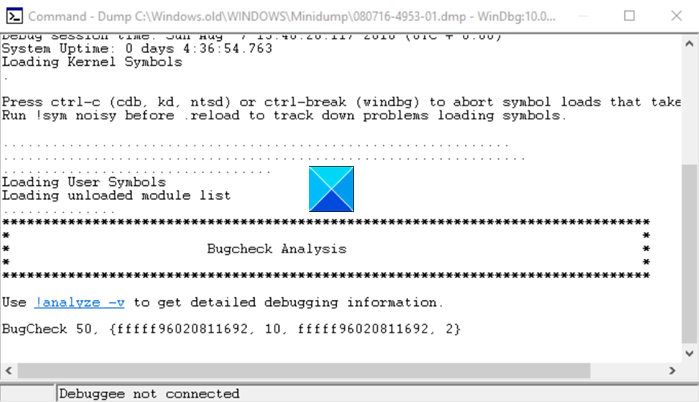
You should see a message, reading – Debuger not connected.
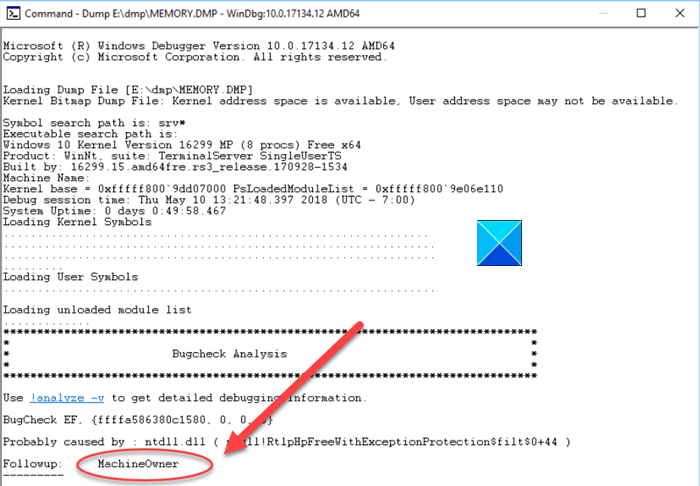
After all the symbols have been successfully downloaded, the following message should be visible at the bottom of the dump text – Followup: MachineOwner.
Read: What are System Error Memory Dump Files in Windows.
Enter a command into the command bar at the bottom of the dump window to analyze the dump file. You should see a link that says !analyze -v under Bugcheck Analysis.
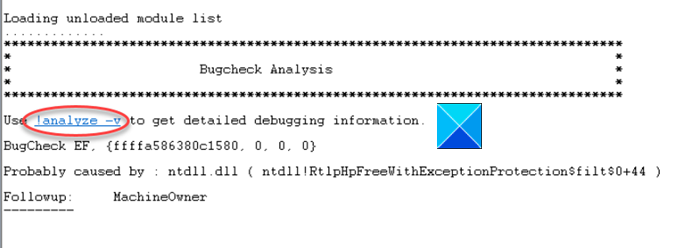
Hit the link to enter the command !analyze -vin the prompt at the bottom of the page.
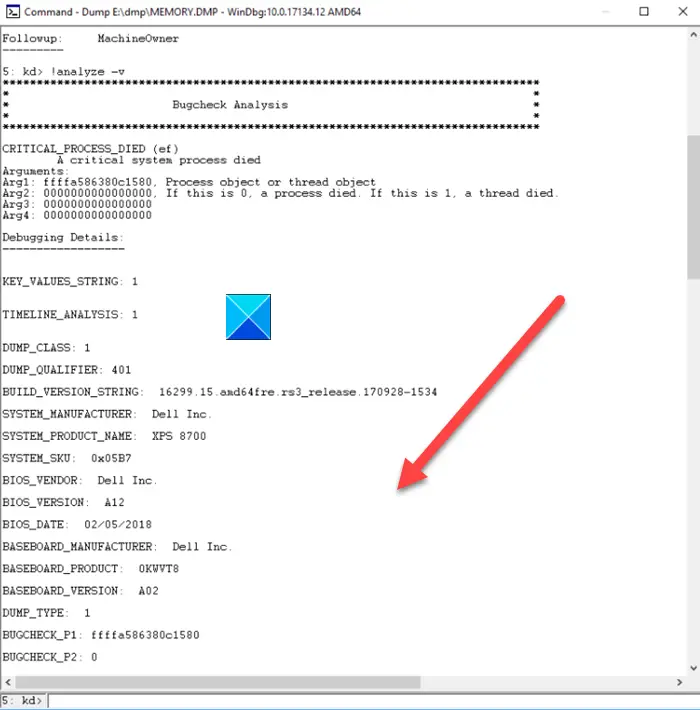
Once done, a detailed bug check analysis should occupy the screen space.

Scroll down to the section where it says STACK_TEXT . The STACK_TEXT field shows a stack trace of the faulting component. Here, you will find be rows of numbers with each row followed by a colon and some text. The text should help you identify the cause of the crash and if applicable what service is crashing it.
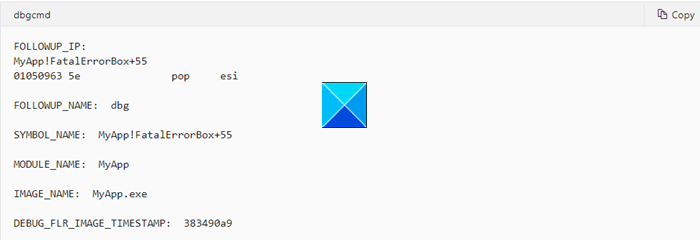
Use the !analyzeExtension to get more details. Do not forget to use the-v
Read: How to manually create a Crash Dump file in Windows 11/10.
Upon execution, the ‘!analyze’ command will determine the instruction that has probably caused the error and display it in the FOLLOWUP_IP field.
- The SYMBOL_NAME – show the symbol
- MODULE_NAME – displays the module
- IMAGE_NAME – displays image name
- DEBUG_FLR_IMAGE_TIMESTAMP – shows image timestamp corresponding to this instruction
Related: How to create Live Kernel Memory Dump File using Task Manager
Take the necessary action to get the issue resolved!
- You can also use the command-line tool Dumpchk.exe to check a memory dump file.
- You can use Crash Dump Analyzer software to analyze crash dump reports.
- Alternatively, you can use WhoCrashed Home Edition to check for errors in a single click. The tool does a post-mortem crash-dump analysis of the Windows Memory Dumps and presents all gathered information in a comprehensible way.
How do I read a minidump DMP file?
In order to read a Small Memory Dump (DMP) file on Windows 11/10, you can follow the above steps. First, you need to locate the file. For your information, you can head to the %SystemRoot%\Minidump folder and find the exact file you want to read. Then, you can open it accordingly and start analyzing the file as per your requirements.
Read: Windows computer creates only Minidump file
How do I open a .DMP file in Windows?
In order to open a .DMP file in Windows, you need to use WinDbg. For that, right-click on the WinDbg and select the Run as administrator option. Next, you can click on the File menu and choose the file you want to read or open. For your information, Windows stores all the DMP files in %SystemRoot%\Minidump folder.
I hope that helps!
Related reads:
Leave a Reply