Microsoft PowerPoint is a powerful tool that we all like to use. There is no other program that is as complete when it comes down to delivering presentations. Now, some of us would love to be able to create a progress bar for presentations. The question is, right now, is it possible?
How to create and use Progress Bar in PowerPoint
The answer is a resounding yes. Anyone with the right information can easily create a progress bar, and guess what? We’ll detail how to do it.
Now, it is possible to manually install a progress bar by installing the relevant shape below each slide. However, that brings additional problems to the table. You see, users must measure the length of every shape that is based on the number of slides in the presentation document.
Also, whenever a slide is removed, you will be required to recreate the progress bar for all other slides. We can’t be bothered with doing things like that, so we’ve decided to go the Macro route. Here’s how!
- Open your preferred PowerPoint presentation
- Select Macros and inject a name
- Paste code in Microsoft Visual Basic for Applications (VBA) window
- Close and run Macro
Let us look at this more from a detailed perspective.
1] Open your preferred PowerPoint presentation
OK, so the first thing you must do here is to open the PowerPoint presentation you want to work with. If not, you can create one from scratch and then work your way up.
2] Select Macros and inject a name

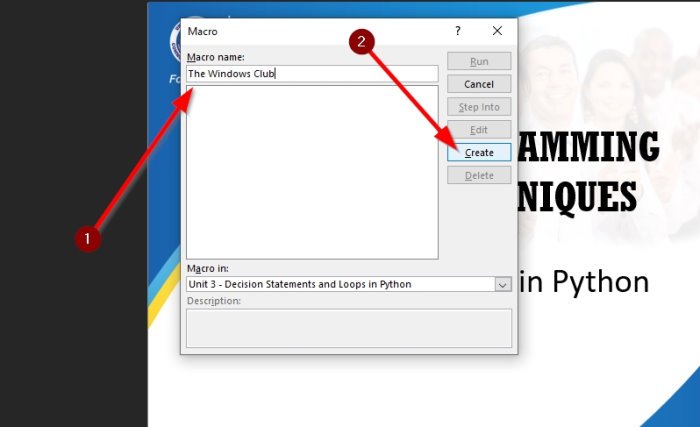
Once you’ve opened your presentation document, you must now go on ahead and click on View, and from there, be sure to select Macros located at the right. A small window should appear right away after you’ve clicked on the button.
The next step is to type a Macro Name. We’ve chosen to add SlideBar, but you are free to include whatever name is best suited. Once that is done, hit the create button to complete this section.
3] Paste code in Microsoft Visual Basic for Applications (VBA) window

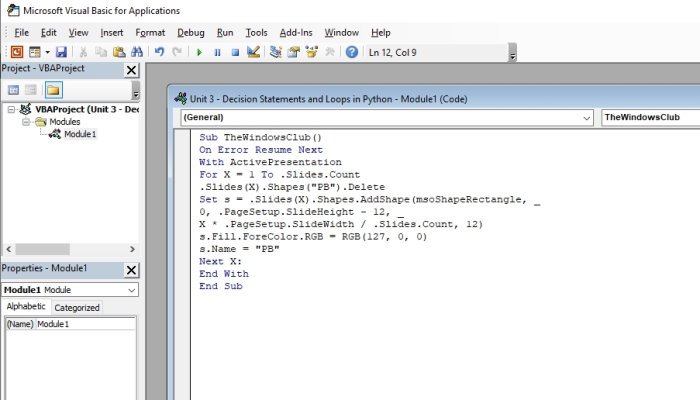
OK, a new window will appear after hitting the Create button. This window is called Microsoft Visual Basic for Applications (VBA), where the magic happens.
From within the editor, you should see the following:
Sub ProgressBar()

End Sub
Click between the two lines of the code, and be sure to copy and paste the following right away:
On Error Resume Next
With ActivePresentation
For X = 1 To .Slides.Count
.Slides(X).Shapes("PB").Delete
Set s = .Slides(X).Shapes.AddShape(msoShapeRectangle, _
0, .PageSetup.SlideHeight - 12, _
X * .PageSetup.SlideWidth / .Slides.Count, 12)
s.Fill.ForeColor.RGB = RGB(127, 0, 0)
s.Name = "PB"
Next X:
End With
4] Close and run Macro

After you’ve completed the above task, you must now close the VBA window right away.
Once that is done, click on the View tab from within PowerPoint, then select Macros.
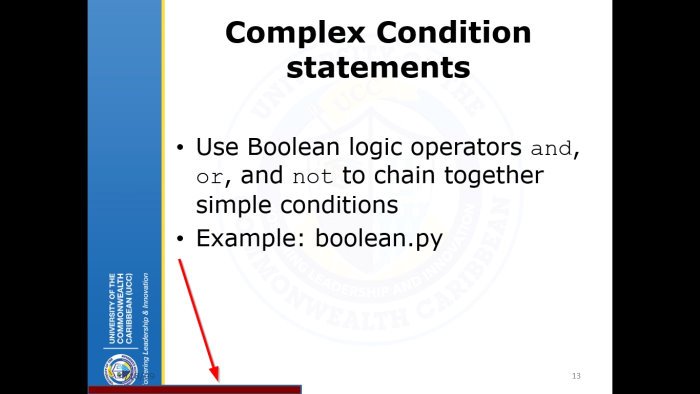
Choose the name of the Macro, and finish off by selecting Run, and that’s it.
Now read: How to create a Funnel Chart in Excel, PowerPoint and Word.