Microsoft Excel Slicers are easy-to-use visual controls added to Excel that allows to quickly and easily filter data in an interactive way by selecting values from a list. The slicer feature provides the user with a rich visualization of the pivot table on which dynamic segmenting & filtering can be applied to display the required data. Using the search filter, the time taken to search a record in the large data set is significantly reduced.

A slicer typically displays the components:
- Filtering button that is not selected indicates that the item is not included in the filter.
- Filtering button that is selected indicates that the item is included in the filter.
- A Clear Filter button removes the filter by selecting all items in the slicer.
- Slicer displays the following components:
- Slicer header indicates the category of the items in the slicer.
- Border moving and resizing controls allow you to change the size and location of the slicer.
- Scroll bar enables scrolling when there are more items than are currently visible in the slicer.
How to use Slicers to filter Data in Excel
- Click anywhere in the table or PivotTable.
- On the Home tab, go to Insert > Slicer.
- In the Insert Slicers dialog box, select the checkboxes
- A slicer will be created for every field that you selected.
- Clicking any of the slicer buttons will automatically apply that filter to the linked table or PivotTable.
- To select more than one item, hold Ctrl, and then select the items that you want to show.
- To clear a slicer’s filters, select Clear Filter Delete in the slicer.
If you want to connect a slicer to more than one PivotTable, go to Slicer > Report Connections > check the PivotTables to include, then select OK.

KeyTips to reach Slicer in Excel: Alt + N + SF
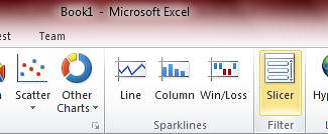
Slicer can be found under the Insert tab in the Ribbon. A slicer acts as a report filter, so you can hook it up to a PivotTable, PivotChart, or CUBE function to filter them and create an interactive report.
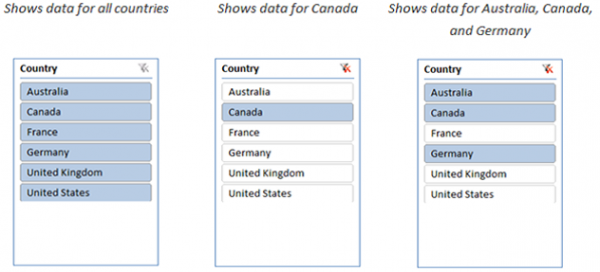
In the example illustrated below, there is a slicer in three different Countries. One or more or all countries can be selected. This would reflect a filtered data corresponding to the number of selected Countries.

In contrast, selecting a tile in a slicer in Excel is easy – it takes just one click.
To select multiple tiles, use combinations of ctrl+click, shift+click, or click+drag.
Using slicers to create your reports will invite interaction, enabling you and your collaborators to spend less time sifting and more time analyzing. Slicers also works with Excel Services and Excel Web App too, so you can work and share on the web as well.
I hope this helps.
Read: How to calculate Weighted Average in Excel with percentages.
Very interesting, I have just written a few quick Excel Training tips you may find useful.