For everything that takes place on a Windows computer, the operating system considers it as an Event internally. So, when any processes or tasks go wrong, a user can trace out the exact breakpoint. For this, first, let us check what some common Service Event IDs for User Profiles stand for.
- Event ID 1500: Occurs when a user fails to log in to their computer with a Temporary Profile.
- Event ID 1511: This occurs when the operating system cannot find a dedicated user profile for the user and signs in the user with a temporary profile.
- Event ID 1530: This occurs when the operating system detects that the registry file for a particular user profile is being used by other applications or processes. This behavior is by design.
- Event ID 1533: This occurs when Windows cannot delete the user profile folder located at C:\Users\<Username> because it is being used by another application or process.
- Event ID 1534: Occurs mainly for DOMAIN joined User Profiles.
- Event ID 1542: This occurs when the User Profile registry and the data file is corrupt.
Now, we will check how to trace and troubleshoot the errors with respect to these events.
Troubleshoot User Profile Service Event IDs on Windows
To troubleshoot User Profile Service Event IDs on a Windows 11/10 computer, we will undertake four main steps. This applies to Windows 11/10 and Windows Server. They are:
- Checking events in the Application Log.
- Viewing the Operational log for the User Profile Service.
- Enabling and Viewing analytic and debug logs.
- Creating and decoding a trace.
1] Checking events in the Application Log
In this step, we will load and unload user profiles to use the Event Viewer to check the whole log.
To do this, start by opening the Event Viewer. You can find it by searching for it in the Cortana Search Box.
Once the Event Viewer opens, navigate to the following path from the left part navigation menu of the window-
Windows Logs > Application

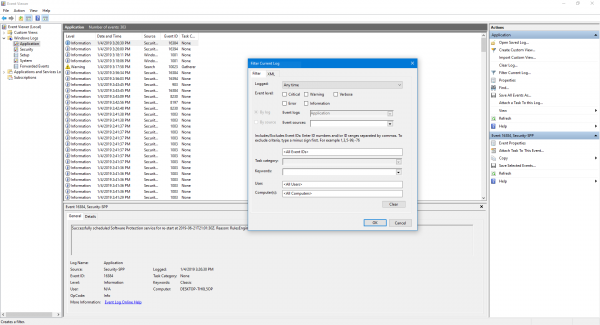
Now, from the right side pane of Actions, select Filter Current Log. This will open a new dialog box.
In the box labeled as Event sources, select User Profiles Service checkbox and click OK.
It will show only those events which are related to the User Profiles.
You can find details like their IDs, occurrence date and time and more in the information box in the bottom part of the Event Viewer.
2] Viewing the Operational log for the User Profile Service
This step will help you to dig in further in tracing the issue by pinpointing to the Processes or tasks causing the issue.
For this, first, open the Event Viewer as done in Step 1.
Now, navigate to the following path from the left side pane for navigation,
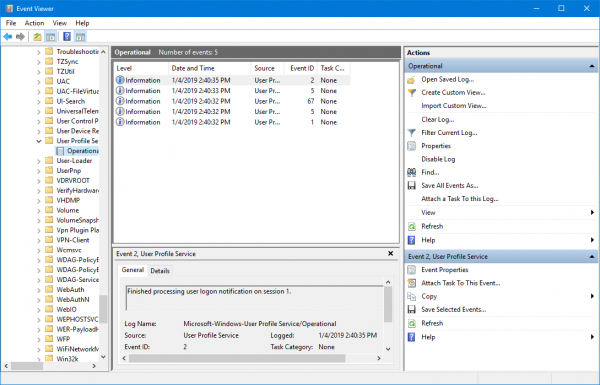
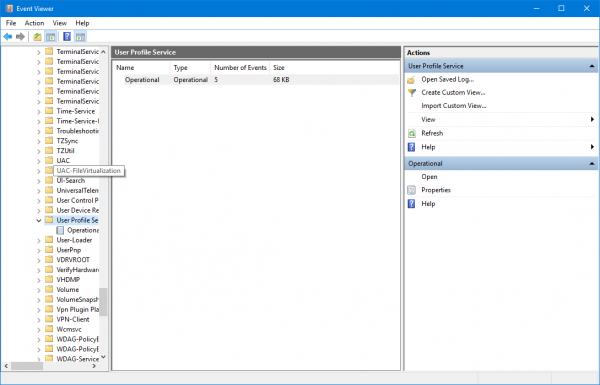
Applications and Servcies Logs > Microsoft > Windows > User Profile Service > Operational.

This will lead you to a location where you can examine the events that occurred around the moment of occurrence of errors that you found in the Application Log.
3] Enabling and viewing analytic and debugging logs
Now, if you want to dig even deeper than the Operational Log, you can enable and view the analytic and debug logs. To do that,
Start by clicking on View and then select Show Analytic and Debug Logs in the Actions pane.
Then navigate to Application and Services Logs > Microsoft > Windows > User Profile Service > Diagnostic in the left side navigation pane.
Click on Enable Log and then select Yes. This will enable the Diagnostic log and will start logging.

When done troubleshooting the issue, you can navigate along the following path to hide analytic and debug logging,
Diagnostic > Disable Log
Then click on View and finally clear the Show Analytic and Debug Logs check box.
4] Creating and decoding a trace
In case, the other steps do not help you much; this will be the ultimate step that you can take. It includes using Windows PowerShell to Create and decode a trace.
First, log in to the computer using the administrator account which is experiencing the issues.
Then you need to open an elevated PowerShell window on the path to the local folder that has been previously created.
Enter the following commands in the command line window-
logman create trace -n RUP -o \RUP.etl -ets
logman update RUP -p {eb7428f5-ab1f-4322-a4cc-1f1a9b2c5e98} 0x7FFFFFFF 0x7 -ets
Now, you need to switch user to another user account on the same computer. Make sure that you NOT log off from that user account.
Reproduce that same problem.
After doing that, sign in as a local Administrator again.
Enter the following commands in the command line window to save the captured log into an ETL format file,
logman stop -n RUP -ets
Now, finally, to make it readable, type the following command,
Tracerpt \RUP.etl
Here, the path will indicate the location of the readable file.
You can now open the Summary.txt or Dumpfile.xml log file to read the logs using either Notepad or Microsoft Excel respectively.
All you need to look is for events that are stated as fail or failed. However, those that are stated as Unknown can simply be ignored.
You can learn more about these troubleshooting steps in the official documentation from Microsoft.
What is User Profiles in Windows OS?
Windows enables administrators to configure background uploading of roaming user profile registry data to a server while the user remains logged on to the computer. Windows also changes how administrators customize default user profiles.